Signal Station
- Indikatoren
- Version: 1.1
- Aktualisiert: 25 Dezember 2021
- Aktivierungen: 10

Warnung: Unser Produkt arbeitet mit 28 Symbolen. Die durchschnittliche Genauigkeit der Signale liegt bei 99%. Wir sehen Signale unter 15 Pips als erfolglos an.
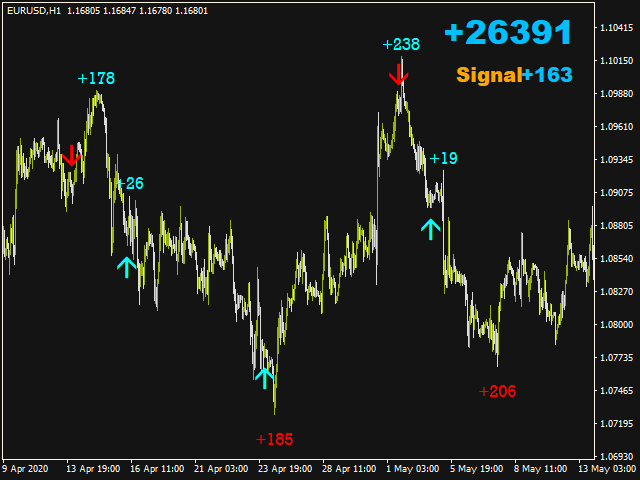
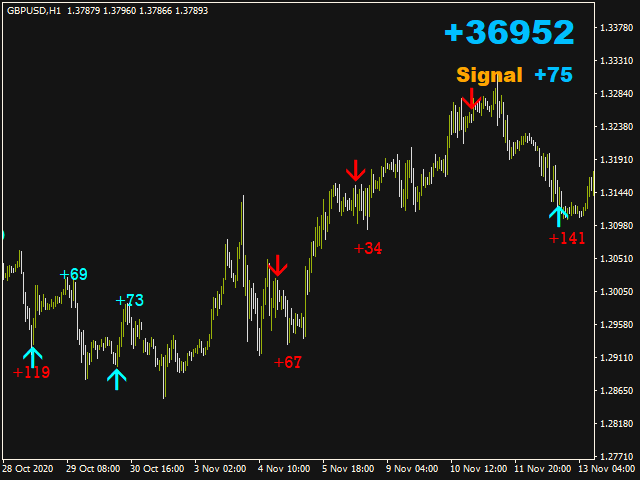
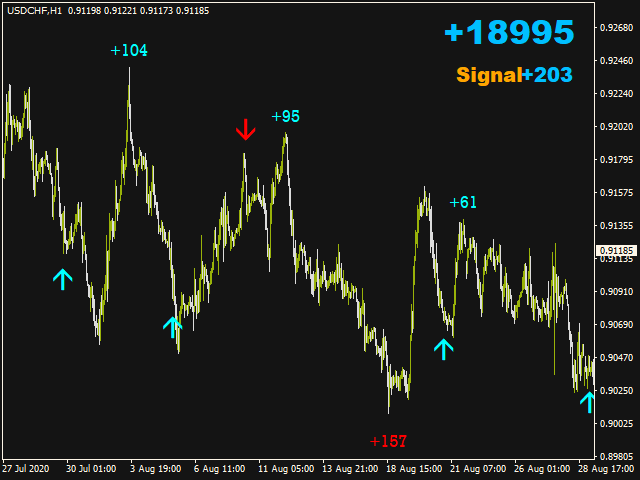
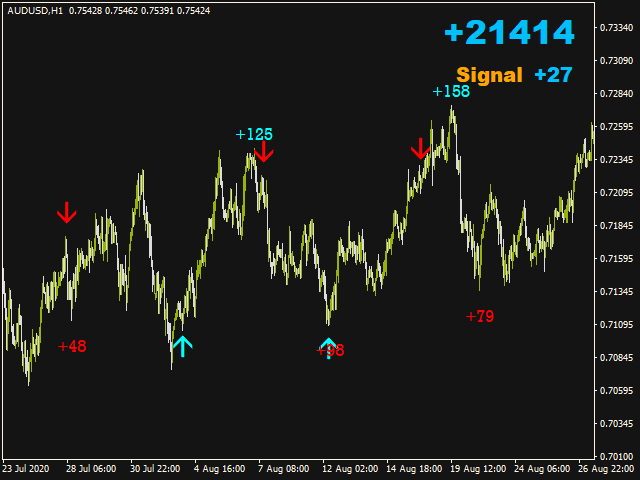
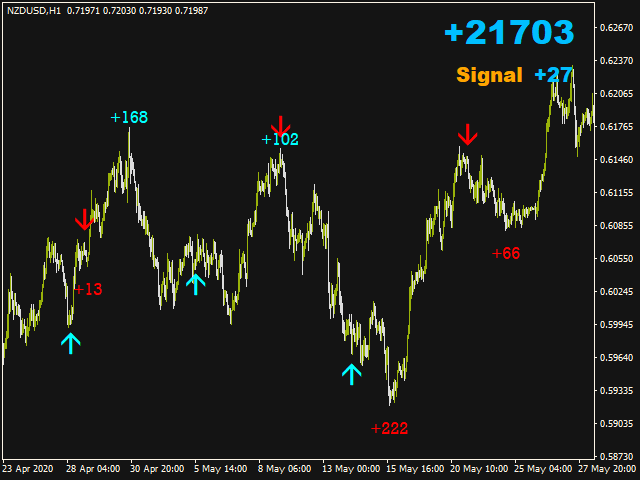
Der Signal Station Indikator ist für den Signalhandel konzipiert. Dieser Indikator generiert Trendsignale.
Er verwendet viele Algorithmen und Indikatoren, um diese Signale zu erzeugen. Er versucht, ein Signal von den Punkten mit dem höchsten Trendpotenzial zu erzeugen.
Dieser Indikator ist ein vollständiges Handelsprodukt. Dieser Indikator benötigt keine zusätzlichen Indikatoren.
Der Indikator wird auch nicht neu gezeichnet. Der Punkt, an dem das Signal gegeben wird, ändert sich nicht.
Der Indikator hat einen Pips-Zähler. Sie können sehen, wie viele Pips er sammelt.
====Features und Vorschläge====
- TimeFrame: H1
- Arbeitet mit 28 Symbolen
- Arbeitet mit mindestens 10 für Sie geeigneten Paaren
- Es ist kein zusätzlicher Indikator erforderlich.
- Mit den Warnfunktionen können Sie die Alarmeinstellungen nach Belieben ändern.
- Dank der Warnfunktion muss der Benutzer nicht am Bildschirm sitzen.
- Der Indikator verfügt über einen Pips-Zähler. Sie können sehen, wie viele Pips er sammelt.
- Es werden Signalpunkt- und Signalzeitwarnungen gesendet.
- Wenn das Signal Sie warnt, beginnen Sie mit dem Handel.
- Der Indikator ist leicht zu bedienen, einfach und verständlich.
- Zusätzlich zu den Erinnerungsmeldungen gibt es Warnmeldungen per E-Mail und über die mobile Anwendung.
- Versuchen Sie, während der Newsletter-Zeiten nicht zu handeln.
====Parameter====
- Alerts On= Dient dazu, alle Alerts ein- oder auszuschalten.
- Wahr
- Falsch
- Alerts= Einstellung zum Ein- und Ausschalten von Signalwarnungen.
- Wahr
- Falsch
- E-Mail= Verwenden Sie den Abschnitt, um Signalwarnungen per E-Mail zu erhalten.
- Wahr
- Falsch
- Push= Verwenden Sie diesen Abschnitt für Signalwarnungen über eine mobile App.
- Richtig
- Falsch
- ====Pfeileinstellung====
- Verkaufspfeil-Code= Geben Sie hier eine Zahl ein, um die Form des Signalpfeils zu ändern.
- Breite des Verkaufspfeils= Geben Sie hier einen Wert ein, um die Größe des Pfeils festzulegen.
- Sell Color= Hier können Sie die Farbe des Pfeils ändern.
- Sell Pips Color= Einstellung der Farbe des Sell Pips-Zählers
- Buy Arrow Code= Geben Sie hier eine Zahl ein, um die Form des Signalpfeils zu ändern.
- Buy Arrow Width= Geben Sie hier einen Wert ein, um die Größe des Pfeils einzustellen.
- Buy Color= Hier können Sie die Farbe des Pfeils ändern.
- Buy Pips Color= Einstellung der Farbe des Buyu-Pips-Zählers
- ====Chart-Farbe====
- All Chart Colors= Hier können Sie die Chart- und Kerzenfarben ein- oder ausschalten.