MT5 Instrument backtester
- Indikatoren
- Version: 1.1
- Aktivierungen: 5
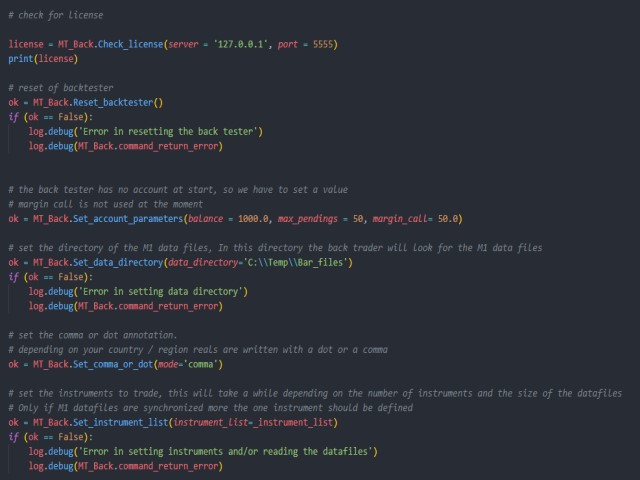
In Kombination mit dem BT können Sie Python-Strategien testen.
- Der BT hat eine Historie von M1-Balken ab 2016 (über 5 Jahre, Quelle DukasCopy).
- In diesem Moment wird die Historie für die 28 Basisinstrumente verfügbar sein.
- Alle Zeitrahmen werden von diesen M1-Balken abgezogen (M5, M10, M15, M20, M30, H1, H2, H3, H4, H6, H8, H12, D1).
- Durch die Historie in M1-Takt-Schritten oder in mehreren M1-Takt-Schritten gehen.
- Orders und Positionen werden bei jedem Schritt aktualisiert.
- Alle Historie-Balken der Instrumente werden für Multi-Instrumente und Multi-Timeframe-Tests synchronisiert.
- Eröffnung und Schließung von Trades (pendings, Markt).
- Verfolgung des minimalen und maximalen Gewinns von offenen Positionen.
- Zusätzliche Kommentare für Trades, wie z.B. Eröffnungsbedingungen und/oder Schließungsbedingungen.
- Renko-Balken
- Geplant
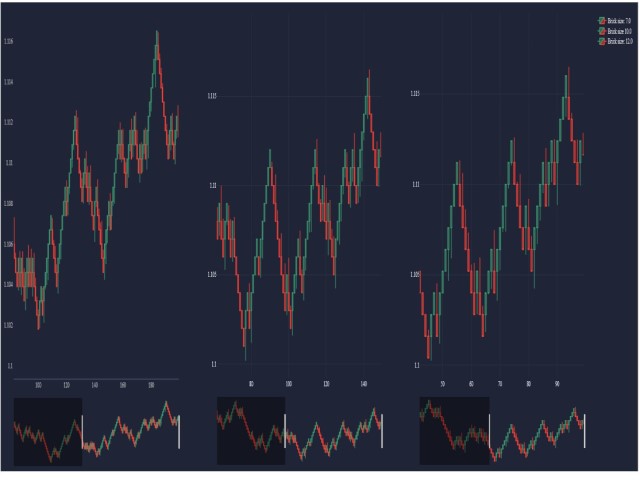
- Renko-Balken (3x verschiedene Steingrößen parallel), jetzt implementiert in Version V1_02
- Rote Nachrichten (FF)
Die Kommunikation zwischen Python-Skript und Windows-App erfolgt über Socket-Kommunikation. Das Python-Skript ist der Client.
Auch eine .DLL-Schnittstelle ist verfügbar.
In der Demoversion arbeitet der BT mit voller Funktionalität für EURUSD, USDJPY und AUDNZD, für die anderen Instrumente ist eine Lizenz erforderlich.
Für Personen, die eine lizenzierte Version der Pytrader_API(MT4 oder MT5) besitzen, ist der BT kostenlos.
Es ist auch eine MT4-Version verfügbar.
Für den Support haben wir einen Discord Channel eingerichtet. Discord-Kanal.
Die Windows-App, Python-Skripte, Dokumentation, .... finden Sie hier.
Mit freundlichen Grüßen