MT5 Instrument backtester
- Indicadores
- Versión: 1.1
- Activaciones: 5
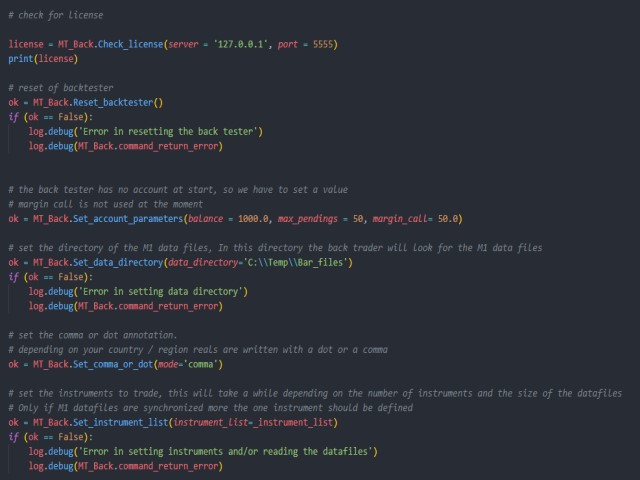
En combinación con el BT puedes probar estrategias python.
- El BT tiene un historial de barras M1 a partir de 2016 (más de 5 años, fuente DukasCopy).
- En este momento estará disponible el historial para los 28 instrumentos básicos.
- Todos los marcos de tiempo se deducen de estas barras M1 (M5, M10, M15, M20, M30, H1, H2, H3, H4, H6, H8, H12, D1).
- Recorrer el historial en incrementos de barras de M1 o en incrementos múltiples de barras de M1.
- Las órdenes y posiciones se actualizarán en cada incremento.
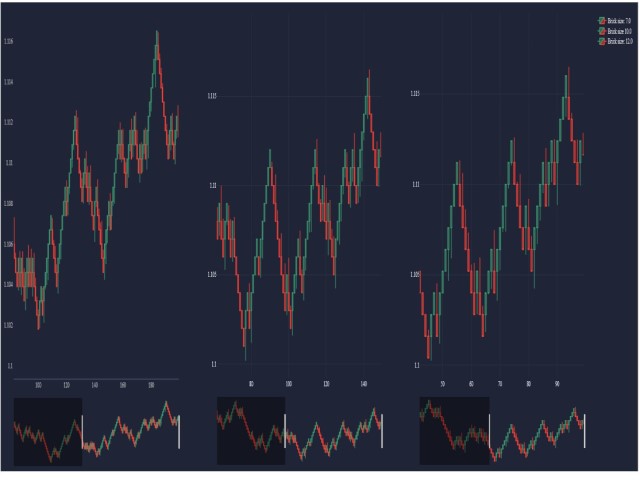
- Todas las barras del historial de los instrumentos están sincronizadas para pruebas con múltiples instrumentos y marcos temporales.
- Apertura y cierre de operaciones (pendientes, mercado).
- Seguimiento del beneficio mínimo y máximo de las posiciones abiertas.
- Comentarios adicionales para las operaciones, como condiciones de apertura y/o cierre.
- Barras Renko
- Planificado
- Barras Renko (3x diferentes tamaños de ladrillo en paralelo), ahora implementado en la versión V1_02
- Noticias rojas (FF)
La comunicación entre el script python y la aplicación windows es por socket. El script python es el cliente.
También está disponible una interfaz .DLL.
En demo el BT trabaja con funcionalidad completa para EURUSD, USDJPY y AUDNZD, para los otros instrumentos se necesita una licencia.
Para las personas que tienen una versión con licencia de Pytrader_API(MT4 o MT5) el BT es gratuito.
También hay una versión MT4 disponible.
Para soporte tenemos un canal de discordia disponible. Canal de discordia.
La aplicación para Windows, scripts en python, documentación, .... puedes encontrarlos aquí.
Saludos cordiales