All TimeFrames Stochastic MT4
- Indikatoren
- Version: 1.4
- Aktualisiert: 23 Mai 2020
- Aktivierungen: 5

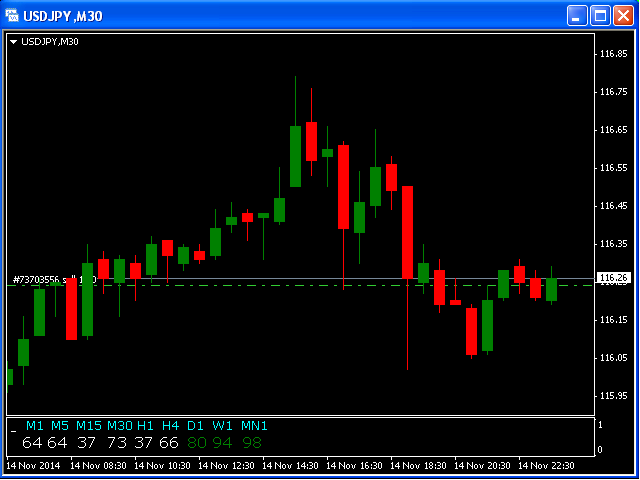
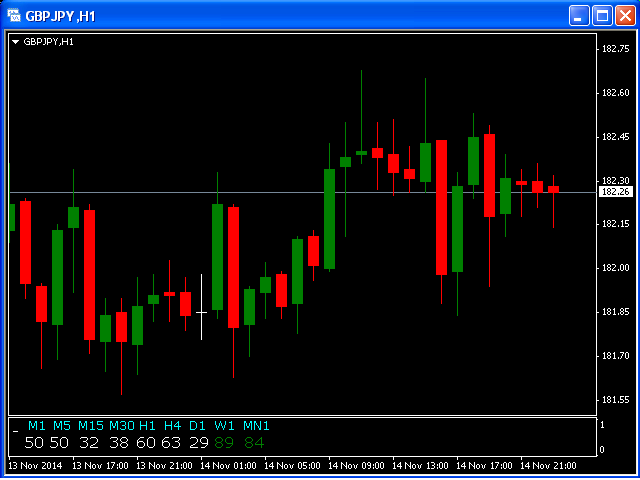
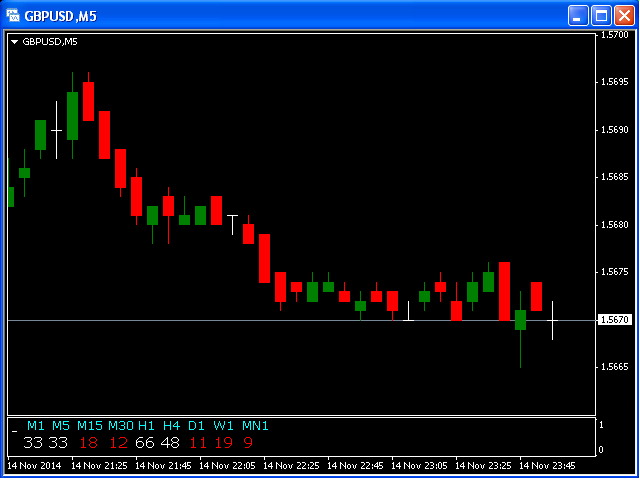
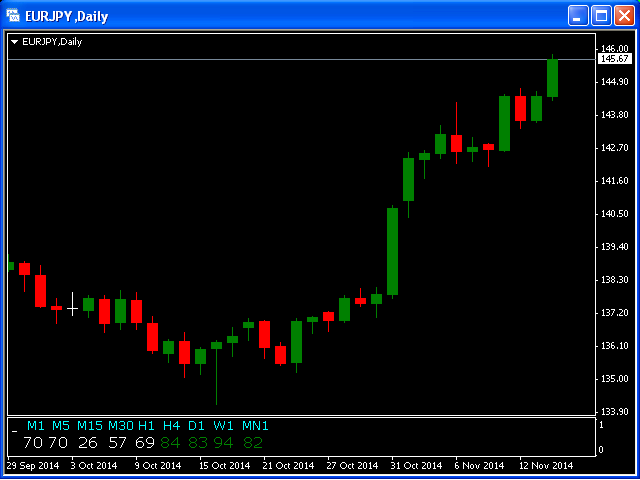
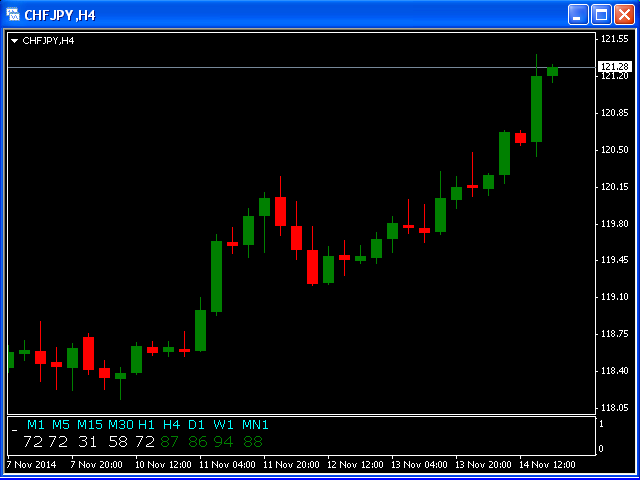
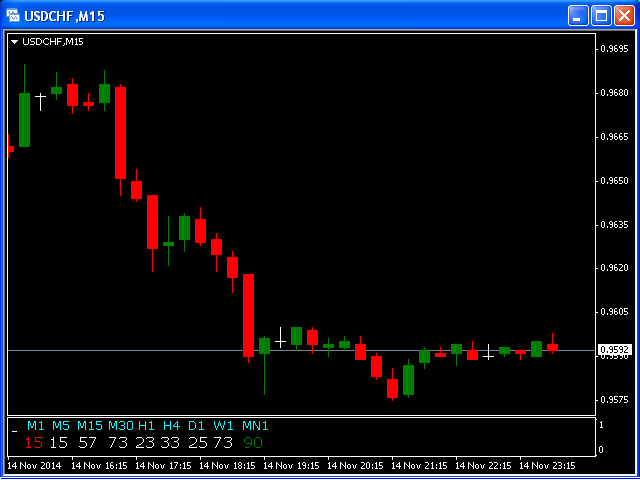
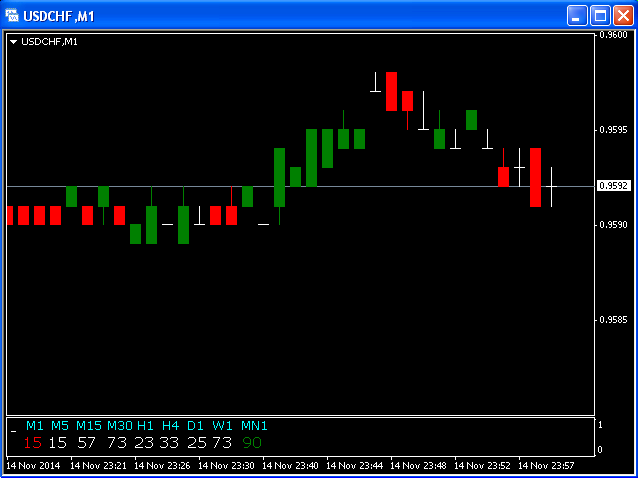
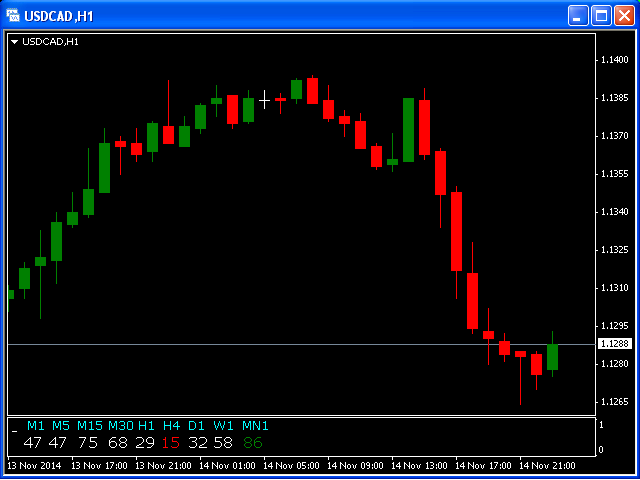
Dieser Indikator basiert auf dem klassischen Indikator STOCHASTIC und wird für diejenigen hilfreich sein, die es lieben und wissen, wie man nicht eine visuelle, sondern eine digitale Darstellung des Indikators verwendet. Der MT4-Indikator Stochastik für alle Zeitrahmen zeigt die Werte jedes Zeitrahmens (M1, M5, M15, M30, H1, H4, D1, W1 und MN1).
Sie können die Haupteingabeparameter für jede Stochastik in jedem TF ändern.
Beispiel für M1:
- sTF1_____ = "M1";
- K_Periode1 = 5;
- D_Periode1 = 3;
- S_Periode1 = 3;
- Methode1 = MODE_EMA.