BB St Dev
- Indikatoren
- Version: 2.0
- Aktualisiert: 22 August 2018
- Aktivierungen: 5

BB St Dev
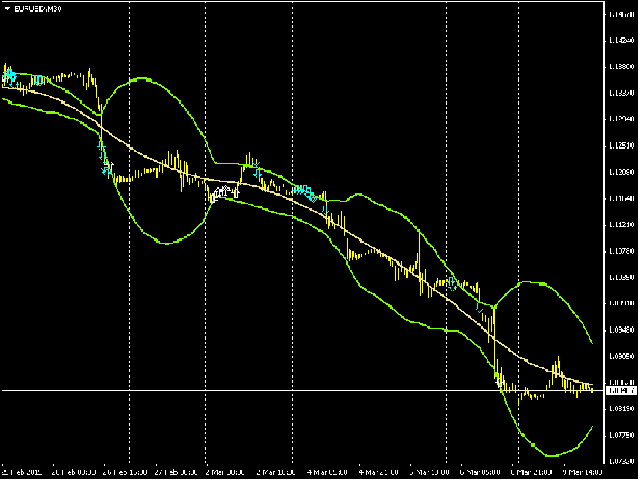
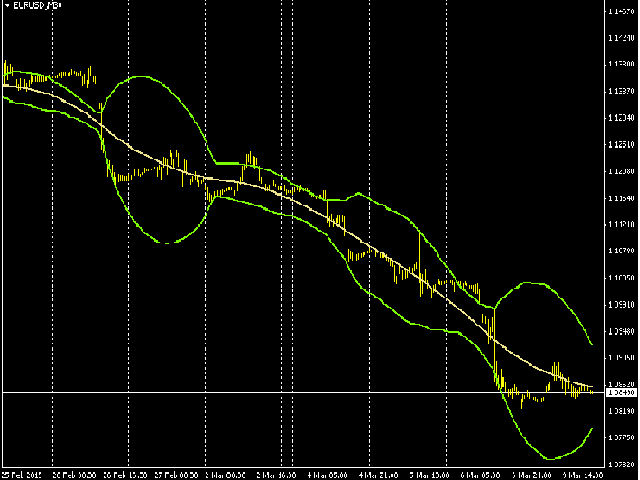
BB St Dev ist analog zum Bollinger-Indikator.
Der obere und untere Teil des Bollinger-Kanals wird mit Hilfe von iStdDev berechnet.
iStdDev ist ein Standardindikator von МetaТrader 4.
Dergleitende Durchschnitt hat einen speziellen Glättungsalgorithmus.
Einstellungen
- M - Periode des gleitenden Durchschnitts
- BandsDeviations-Parameter - Faktor für die Erzeugung des Kanals. Abgesehen von den klassischen Bollinger Bändern können die BandsDeviations hier einen beliebigen Wert haben.
- Visio-Parameter
- Wenn Visio = False, wird dieser Indikator mit dem Bollinger Bands Indikator übereinstimmen.
- Ist Visio = True, zeigt dieser Indikator Punkte für mögliche Ordereröffnungen an.
Wie man diesen Indikator konfiguriert
- Treffen Sie eine Auswahl in: Charts =>Indikatorenliste =>BBand St Dev=>Bearbeiten.
- Das Fenster des Indikators wird erscheinen.
- Stellen Sie die Parameter ein.
- Erstellen Sie eine Vorlage: Charts =>Vorlage =>Vorlage speichern.


Der Benutzer hat keinen Kommentar hinterlassen