SqrtDev
- Indikatoren
-
Sergey Deev
 I'm implementing your ideas in MQL4: https://www.mql5.com/ru/job/new?prefered=work2it
 - Version: 1.1
- Aktualisiert: 5 März 2021
- Aktivierungen: 5
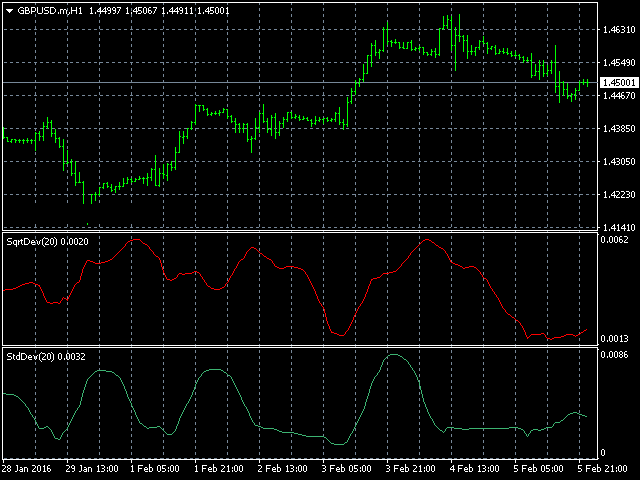
Der Indikator zeigt die Standardpreisabweichung von der gleitenden Durchschnittslinie im zusätzlichen Fenster an. Der Screenshot zeigt den Standardindikator (unten) und SqrtDev (oben).
Parameter
- SqrtPeriod - Wurzelmittellinie und Zeitraum der Standardabweichung.
- SqrtPrice - angewandter Preis (Dropdown-Liste).
- BarsCount - Anzahl der verarbeiteten Balken (reduziert die Downloadzeit bei der Anwendung auf ein Diagramm und bei der Verwendung in Programmen).


Der Benutzer hat keinen Kommentar hinterlassen