Auto Trend Lines
- Indikatoren
- Version: 1.6
- Aktualisiert: 25 März 2020
- Aktivierungen: 5
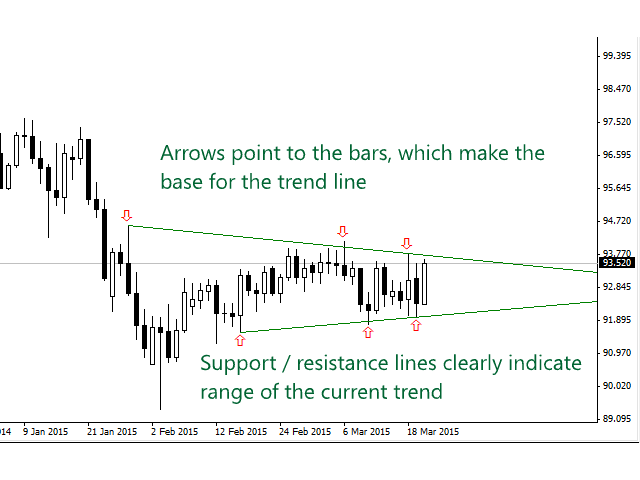
Legen Sie den Indikator einfach auf das Diagramm und die Unterstützungs- und Widerstandsniveaus werden automatisch angezeigt!
Der Indikator zum automatischen Einzeichnen von Unterstützungs- und Widerstandsniveaus auf der Basis von DREI Punkten.
- Die identifizierten Punkte werden auf dem Chart markiert
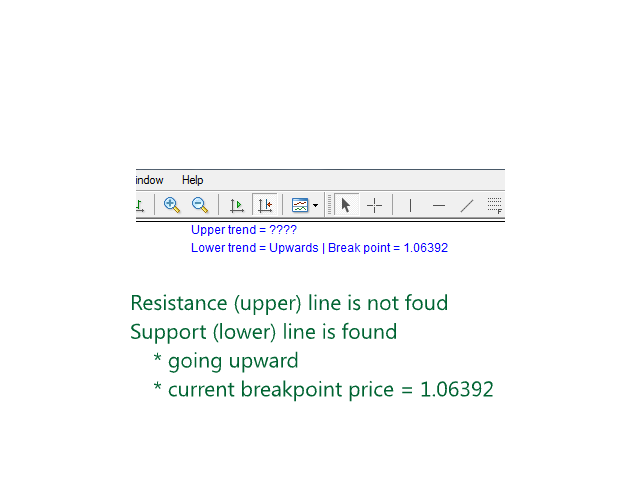
- Der Indikator zeigt den Durchbruch des Preises sowohl für Aufwärts- als auch für Abwärtstrends an (falls gefunden)
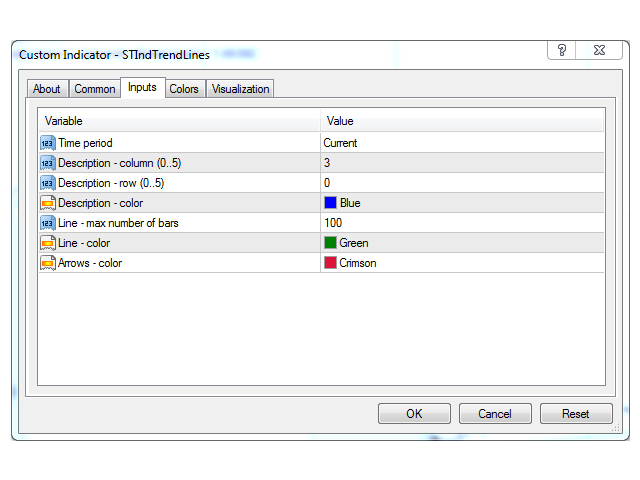
- Sie können festlegen, auf wie viele Balken der Indikator schauen soll, um Unterstützungspunkte zu identifizieren.
Darüber hinaus können Sie auswählen, auf welchem Zeitrahmen der Indikator arbeiten soll. Das heißt, Sie können den H1-Chart für Ihre Analyse verwenden, während Sie Trend- und Durchbruchspunkte auf dem H4-Chart sehen.
Bitte kontaktieren Sie den Autor, wenn Sie Vorschläge zur Verbesserung des Indikators haben.