Bar 4 Colors for MT5
- Indikatoren
- Version: 1.20
- Aktualisiert: 7 Juni 2021
- Aktivierungen: 5

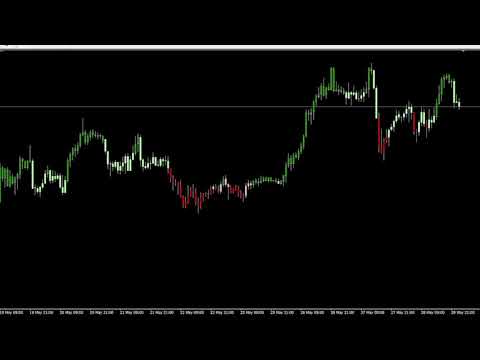
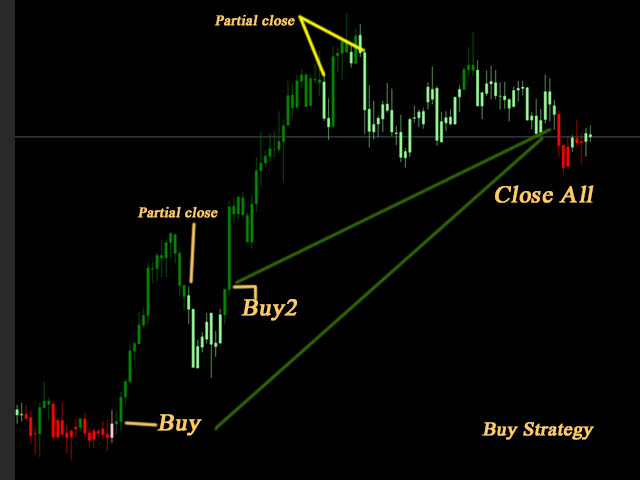
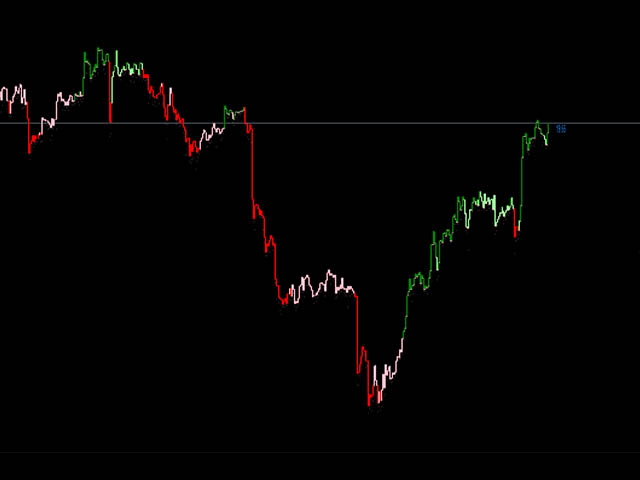
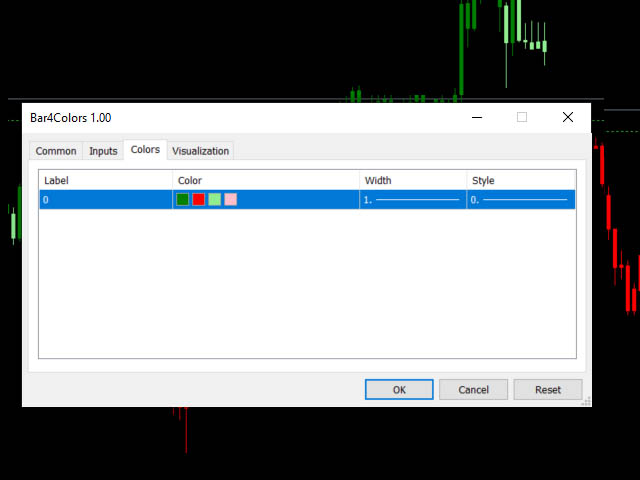
Der grüne Balken bedeutet Aufwärtstrend.
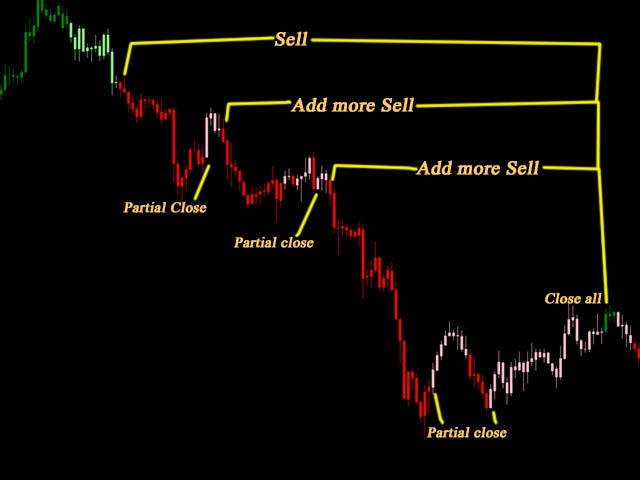
Der rote Balken steht für einen Abwärtstrend.
Der hellgrüne Balken ist kein Trend (Korrektur oder Seitwärtsbewegung), aber immer noch im Aufwärtstrend.
Der rosafarbene Balken ist kein Trend(korrigierend oder seitwärts), befindet sich aber noch im Abwärtstrend.
Sie können einfach auf die Farbe des Balkens schauen und mit einem grünen Balken für eine Long-Position und einem roten Balken für eine Short-Position handeln.
Sie können alle Farben nach Belieben ändern.
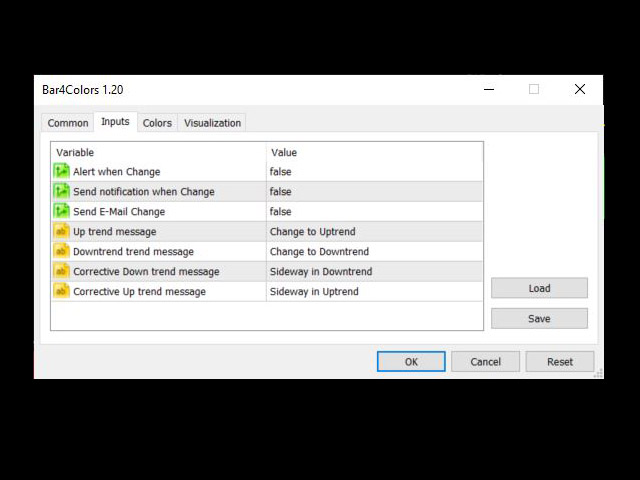
1. Alarmfunktion: Öffnet ein Alarmfenster und spielt einen Ton, wenn sich der Balken verändert.
2. Push-Benachrichtigungen: Sendet Push-Benachrichtigungen an die mobilen Endgeräte, MetaQuotes IDs erforderlich und muss in der Registerkarte "Benachrichtigungen" angegeben werden. (siehe die Kurzdarstellung)
3. E-Mail senden: Sendet eine E-Mail-Benachrichtigung an ein bestimmtes E-Mail-Konto. Der Benutzer kann die E-Mail im Menü [Extras] -> [Optionen] auf der Registerkarte E-Mail einstellen.