MCDX for MT5
- Indikatoren
- Version: 2.1
- Aktualisiert: 10 März 2022
- Aktivierungen: 5

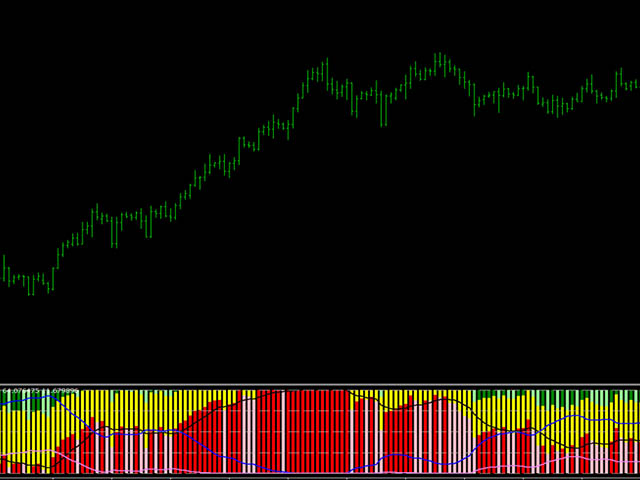
MCDX ist ein Indikator, der auf einer speziellen Formel zur Erkennung von Kauf- und Verkaufsimpulsen basiert
Ein roter Balken bedeutet einen Preisanstieg und ein Kaufmomentum.
Ein grüner Balken bedeutet, dass der Preis fällt und ein Verkaufsmomentum vorliegt.
Ein niedrigerer grüner Balken < 50% bedeutet, dass der Bär die Kontrolle hat, d.h. GRÜN mehr als ROT, um zu verkaufen.
HELLEREROTE FARBE - SCHWACHER Aufwärtstrend oder schwache Bullen-Power
HELLEREGRÜNE FARBE - STARKER Abwärtstrend oder starke Bären-Power
DUNKLEREGRÜNE FARBE - SCHWACHER Abwärtstrend oder schwache Bären-Power
Hat eine Warnfunktion bei Golden Cross und Dead Cross.
GOLDENES KREUZ
Der MA des roten Balkens kreuzt über dem MA des grünen Balkens
Roter MA-Balken kreuzt über dem gelben MA-Balken
:-GelberBalken MA kreuzt übergrünem Balken MA
TOTES KREUZ
MA des rotenBalkens kreuzen unter dem MA des grünen Balkens
:-RotBar ' s MA Kreuz unter Gelb Bar's MA
GelberBalken kreuzt MA untergrünem Balken MA
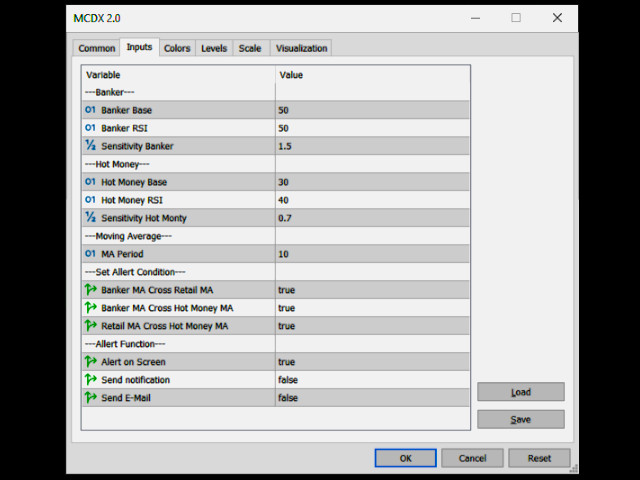
Standard-Einstellungen
Neue Alert-Funktion hinzufügen
Warnung, wenn MAs kreuzen.
- Warnung auf dem Bildschirm
- Benachrichtigung an Handy senden
- Benachrichtigung an E-Mail senden