Ichimoku KumoTwist MM
- Indikatoren
-
Maria Erica Costagliola
 My name is Maria Erica Costagliola, I am software developer and an experienced trader.
You can check on my Product on the Market that will be descripeted both in Italian and English or
if you have a strategy you want to use to create an Expert Advisor or an Indicator, do not hesitate to text me! - Version: 1.0
- Aktivierungen: 5
Ichimoku KumoTwist M_M
Beschreibung in Englisch und Italienisch =
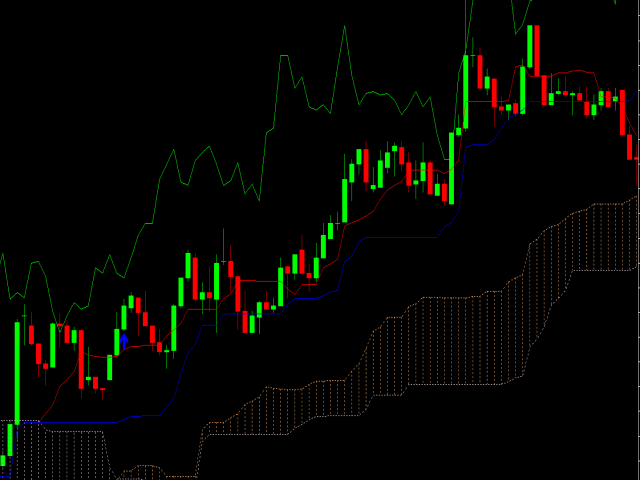
Dieser Indikator basiert auf einer der Strategien mit Ichimoku-Indikator, insbesondere dem KUMO TWIST! Der Kumo Twist ist die Kreuzung der Senkou Span A mit der Senkou Span B. Die Senkou Span A und die Senkou Span B sind die beiden Linien, die die Wolke im Ichimoku-Indikator bilden; er gibt Ihnen Kauf- und Verkaufsignale, wenn sie sich kreuzen, mit Pfeilen und Warnungen.
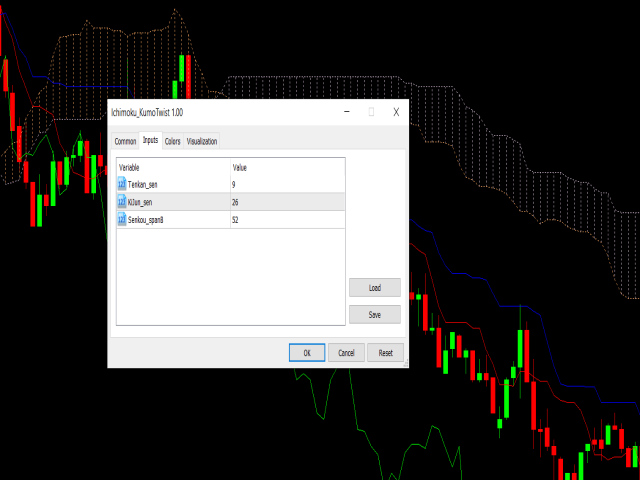
Wenn Sie den Indikator auf dem Chart anbringen, öffnet sich ein Fenster, in dem Sie im Bereich EINGABE auch die wichtigsten Ichimoku-Werte ändern können.
SIGNAL EINGABE =
- BUY= wenn die Senkou Span A Linie über der Senkou Span B Linie kreuzt, zeichnet der Indikator einen blauen Pfeil und der Alert hat das Symbol und das Signal Exaple= "BuyEURUSD";
- SELL= wenn die Senkou Span B Linie unter der Senkou Span A Linie kreuzt, zeichnet der Indikator einen roten Pfeil und der Alarm erhält das Symbol und das Signal Beispiel= "SellEURUSD";
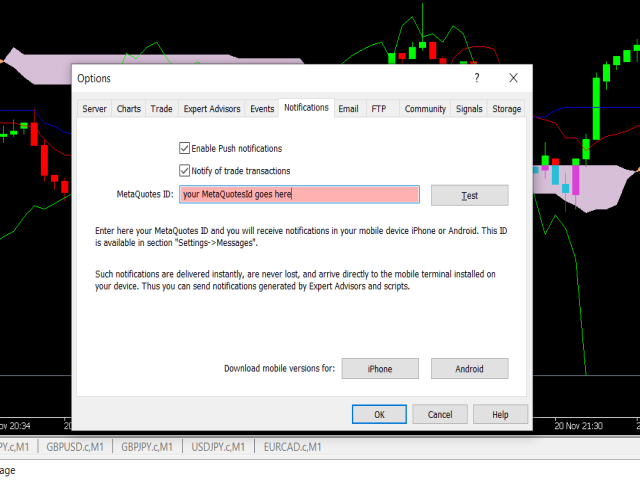
Mit der MetaTrader5 App können Sie Push-Benachrichtigungen über Ihre Signale auf Ihrem mobilen Gerät erhalten.
Um diese Funktion zu aktivieren, folgen Sie diesen Schritten:
- Laden Sie die MetaTrader5 App aus dem Store herunter
- Gehen Sie auf den Tool-Bereich Ihrer MetaTrader5 Plattform auf Ihrem PC und klicken Sie auf Optionen (CTRL+O)
- Gehen Sie auf die Registerkarte Benachrichtigungen und klicken Sie auf "Push-Benachrichtigungen aktivieren".
- Tragen Sie Ihre MetaQuotesID in das Feld ein (Sie finden die MetaQuotesID in Ihrer MetaTrader5 App)
- Klicken Sie auf die Schaltfläche "OK" und warten Sie auf die Benachrichtigung beim nächsten Signal.
INSTALLATION =
Hängen Sie diesen Indikator einfach in das Chart-Fenster der Währungspaare ein und der Indikator passt sich an den Zeitrahmen und das Symbol an.
***************************************************************************************************************************************************************************************
Questo indicatore è basato su una delle strategie dell' indicatore Ichimoku, in particolare prende in considerazione la KUMO TWIST! La Kumo Twist è l'incrocio tra la linea Senkou Span A e la linea Senkou Span B;La Senkou Span A e la Senkou Span B sono le due linee che creano la Nuvola nell'indicatore Ichimoku;da quindi il segnale di Buy e Sell quando si incrociano con delle frecce e degli Allarmi.
Wenn Sie den Indikator in die Grafik einfügen, erscheint eine Anzeige und Sie können im Bereich VALORI DI INPUT auch die Werte des Ichimoku ändern, auf dem der Indikator basiert.
SIGNAL INPUT =
- BUY = quando la Senkou Span A incrocia dal basso verso l'alto con la Senkou Span B, l'indicatore disegnerà una freccia Blu e si aprirà un Allarme con il Simbolo e il Segnale Esempio="BuyEURUSD";
- SELL = quando la Senkou Span B incrocia dall'alto verso il basso con la Senkou Span B, l'indicatore disegnerà una freccia Ross e si aprirà un Allarme con il Simbolo e il Segnale Esempio="SellEURUSD";
Puoi ricevere le notifiche del segnale direttamente sulla tua App MetaTrader5.
Per ottenere il servizio basta seguire questi semplici passaggi:
- Installa l'App MetaTrader5 dallo store
- Wählen Sie den Bereich Tool auf dem MetaTrader5-Paket Ihres PCs und klicken Sie auf Optionen (CTRL+O)
- Vai nel tab Notifications e clicca su "Enable Push Notifications"
- Tragen Sie Ihre MetaQuotesID in das Feld MetaQuotesID ein (Sie finden Ihre MetaQuotesID in der App MetaTrader5 auf Ihrem Handy)
- Clicca su OK e attendi la notifica sul tuo cellulare al prossimo segnale dell'indicatore
INSTALLATION =
Attacca semplicemente l'indicatore al grafico, e si aggiornerà automaticamente con il TimeFrame e il Simbolo di riferimento.