Ichimoku KumoTwist MM
- Indicatori
-
Maria Erica Costagliola
 My name is Maria Erica Costagliola, I am software developer and an experienced trader.
You can check on my Product on the Market that will be descripeted both in Italian and English or
if you have a strategy you want to use to create an Expert Advisor or an Indicator, do not hesitate to text me! - Versione: 1.0
- Attivazioni: 5
Ichimoku KumoTwist M_M
Description in English and Italian =
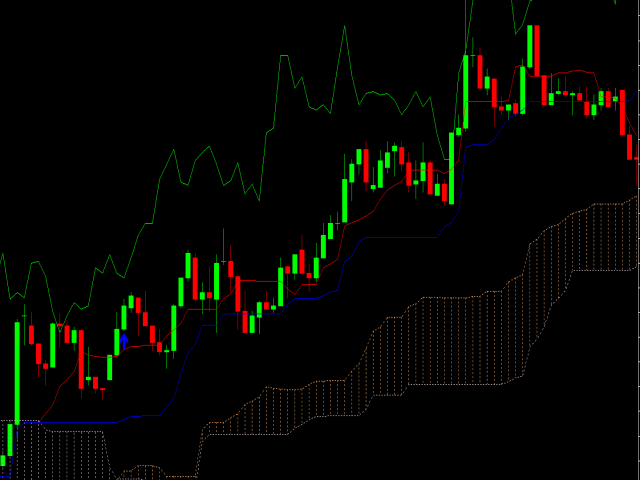
This Indicator is based on one of the Strategies with Ichimoku Indicator, in particular the KUMO TWIST! The Kumo Twist is the cross of the Senkou Span A with the Senkou Span B; The Senkou Span A and the Senkou Span B are the two lines that create the Cloud in the Ichimoku Indicator; it will give you of Buy and Sell when they Cross, with Arrows and Alerts.
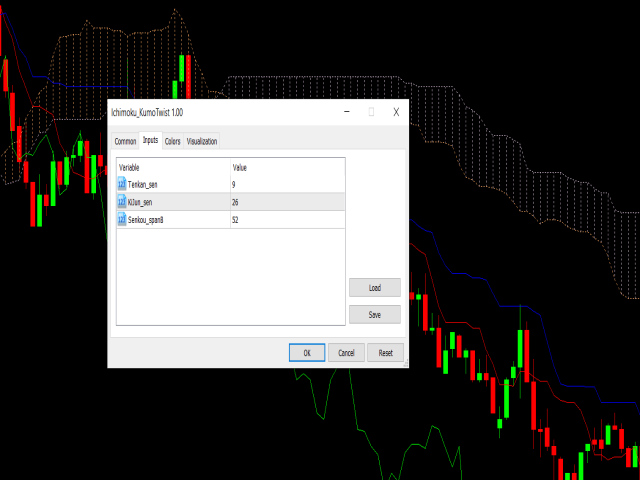
When you attach the indicator on the chart , a window will open where , in the INPUT section, you can also choose to change the main Ichimoku values.
SIGNAL INPUT =
· BUY= when the Senkou Span A Line cross above the Senkou Span B Line, the indicator will draw a Blue Arrow and the Alert will have the Symbol and the Signal Exaple= “BuyEURUSD”;
· SELL= when Senkou Span B Line cross below the Senkou Span A Line , the indicator will draw a Red Arrow and the Alert will have the Symbol and the Signal Example= “SellEURUSD”;
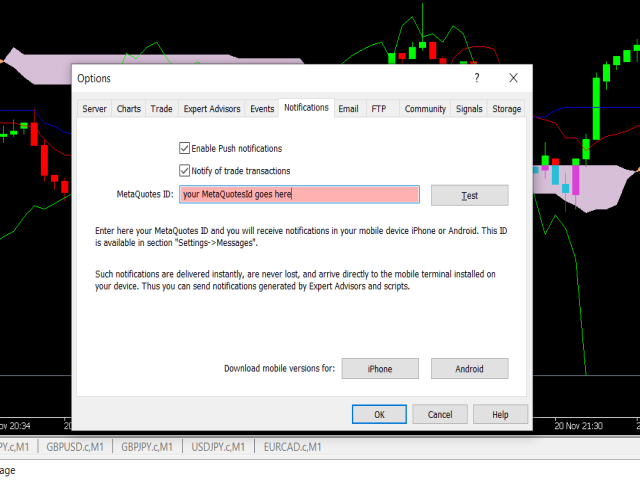
You can receive push notification of your signal on your mobile device with the MetaTrader5 App.
To turn this feature on follow this steps:
· Download MetaTrader5 App from the store
· Go on the Tool section of your MetaTrader5 Platform on your PC and click on Options(CTRL+O)
· Go on the Notifications tab and click on "Enable Push Notifications"
· Put your MetaQuotesID on the section( you will find the MetaQuotesID on your MetaTrader5 App)
· Click on OK button and wait your notification on the next signal
INSTALLATION =
Simply attach this indicator to the chart window of currency pairs and the indicator will adjust to the timeframe and the Symbol.
***************************************************************************************************************************************************************************************
Questo indicatore è basato su una delle strategie dell’ indicatore Ichimoku, in particolare prende in considerazione la KUMO TWIST! La Kumo Twist è l’incrocio tra la linea Senkou Span A e la linea Senkou Span B;La Senkou Span A e la Senkou Span B sono le due linee che creano la Nuvola nell’indicatore Ichimoku;da quindi il segnale di Buy e Sell quando si incrociano con delle frecce e degli Allarmi.
Quando attaccherai l’indicatore al grafico, si aprirà una finestra e nella sezione VALORI DI INPUT, puoi anche cambiare i valori dell’Ichimoku su cui l’inciatore è basato.
SIGNAL INPUT =
· BUY = quando la Senkou Span A incrocia dal basso verso l’alto con la Senkou Span B, l’indicatore disegnerà una freccia Blu e si aprirà un Allarme con il Simbolo e il Segnale Esempio=”BuyEURUSD”;
· SELL = quando la Senkou Span B incrocia dall’alto verso il basso con la Senkou Span B, l’indicatore disegnerà una freccia Ross e si aprirà un Allarme con il Simbolo e il Segnale Esempio=”SellEURUSD”;
Puoi ricevere le notifiche del segnale direttamente sulla tua App MetaTrader5.
Per ottenere il servizio basta seguire questi semplici passaggi:
· Installa l'App MetaTrader5 dallo store
· Vai nella sezione Tool sulla piattaforma MetaTrader5 del tuo PC e clicca su Options(CTRL+O)
· Vai nel tab Notifications e clicca su "Enable Push Notifications"
· Inserisci il tuo MetaQuotesID nel box MetaQuotesID (troverai il tuo MetaQuotesID nell'App MetaTrader5 del tuo cellulare)
· Clicca su OK e attendi la notifica sul tuo cellulare al prossimo segnale dell'indicatore
INSTALLATION =
Attacca semplicemente l’indicatore al grafico, e si aggiornerà automaticamente con il TimeFrame e il Simbolo di riferimento.