Ichimoku KumoTwist MM
- Indicadores
-
Maria Erica Costagliola
 My name is Maria Erica Costagliola, I am software developer and an experienced trader.
You can check on my Product on the Market that will be descripeted both in Italian and English or
if you have a strategy you want to use to create an Expert Advisor or an Indicator, do not hesitate to text me! - Versión: 1.0
- Activaciones: 5
Ichimoku KumoTwist M_M
Descripción en Inglés e Italiano =
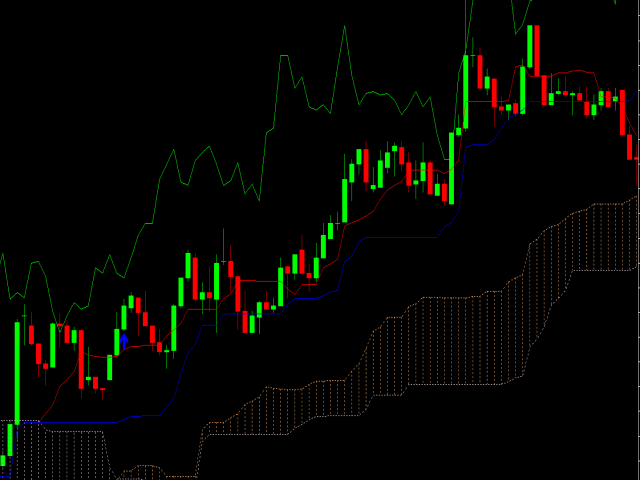
¡Este Indicador se basa en una de las Estrategias con Indicador Ichimoku, en particular el KUMO TWIST! El Kumo Twist es el cruce del Senkou Span A con el Senkou Span B; El Senkou Span A y el Senkou Span B son las dos líneas que crean la Nube en el Indicador Ichimoku; te dará de Compra y Venta cuando se crucen, con Flechas y Alertas.
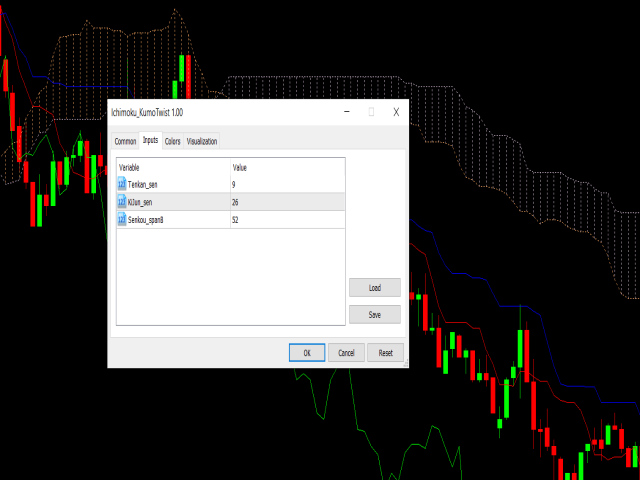
Cuando adjunte el indicador en el gráfico , se abrirá una ventana donde , en la sección ENTRADA, también puede elegir cambiar los valores principales de Ichimoku.
ENTRADA DE SEÑAL =
- COMPRA= cuando la Línea Senkou Span A cruce por encima de la Línea Senkou Span B, el indicador dibujará una Flecha Azul y la Alerta tendrá el Símbolo y el Ejemplo de Señal= "BuyEURUSD";
- SELL= cuando el Senkou Span B Line cruce por debajo del Senkou Span A Line , el indicador dibujará una Flecha Roja y la Alerta tendrá el Símbolo y la Señal Ejemplo= "SellEURUSD";
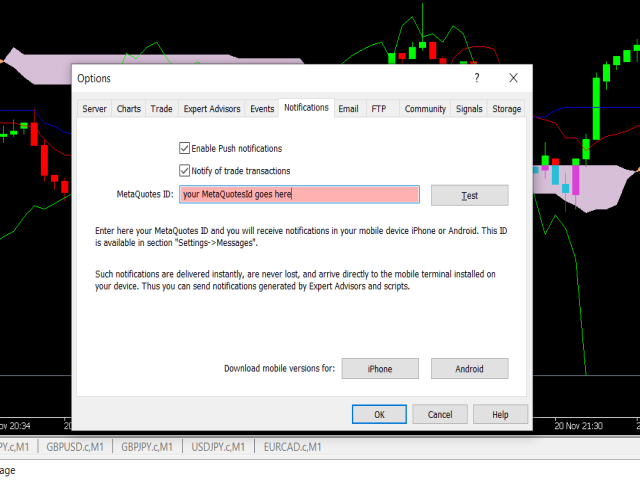
Puede recibir notificaciones push de su señal en su dispositivo móvil con la aplicación MetaTrader5.
Para activar esta función siga los siguientes pasos:
- Descargar MetaTrader5 App de la tienda
- Vaya a la sección Herramientas de su plataforma MetaTrader5 en su PC y haga clic en Opciones(CTRL+O)
- Vaya a la pestaña Notificaciones y haga clic en "Activar Notificaciones Push".
- Ponga su MetaQuotesID en la sección (encontrará el MetaQuotesID en su aplicación MetaTrader5)
- Haga clic en el botón OK y espere su notificación en la próxima señal
INSTALACIÓN =
Simplemente conecte este indicador a la ventana del gráfico de pares de divisas y el indicador se ajustará al marco de tiempo y al Símbolo.
***************************************************************************************************************************************************************************************
¡Este indicador se basa en una de las estrategias del indicador Ichimoku, en particular tiene en cuenta el KUMO TWIST! La Kumo Twist es el cruce entre la línea Senkou Span A y la línea Senkou Span B;La Senkou Span A y la Senkou Span B son las dos líneas que crean la Nuvola en el indicador Ichimoku;da quindi il segnale di Buy e Sell quando si incrociano con delle frecce e degli Allarmi.
Cuando se conecta el indicador al gráfico, aparece una ventana y en la sección VALOR DE ENTRADA, también puede cambiar el valor de Ichimoku en el que se basa el indicador.
SEÑAL DE ENTRADA =
- COMPRA = cuando el Senkou Span A se acerca desde abajo hacia arriba con el Senkou Span B, el indicador abre una banda azul y realiza un Alarme con el Símbolo y el Segnale Ejemplo="BuyEURUSD";
- SELL = cuando el Senkou Span B retrocede desde arriba hacia abajo con el Senkou Span B, el indicador desactiva la frecuencia Ross y realiza un Allarme con el Simbolo y el Segnale Ejemplo="SellEURUSD";
Puede recibir las notificaciones de la señal directamente en su aplicación MetaTrader5.
Para obtener el servicio basta con seguir estos sencillos pasos:
- Instale la aplicación MetaTrader5 desde la tienda
- Vaya a la sección Herramientas en la pantalla MetaTrader5 de su PC y haga clic en Opciones(CTRL+O)
- Vaya a la pestaña Notificaciones y haga clic en "Activar notificaciones push".
- Introduzca su MetaQuotesID en la casilla MetaQuotesID (encontrará su MetaQuotesID en la aplicación MetaTrader5 de su móvil).
- Haga clic en OK y reciba la notificación en su móvil en el siguiente segmento del indicador.
INSTALACIÓN =
Acoplar simplemente el indicador al gráfico, y se agregará automáticamente con el TimeFrame y el Símbolo de referencia.