Volume Impuls VSA
- Indikatoren
- Version: 1.1
- Aktualisiert: 21 November 2021
- Aktivierungen: 5

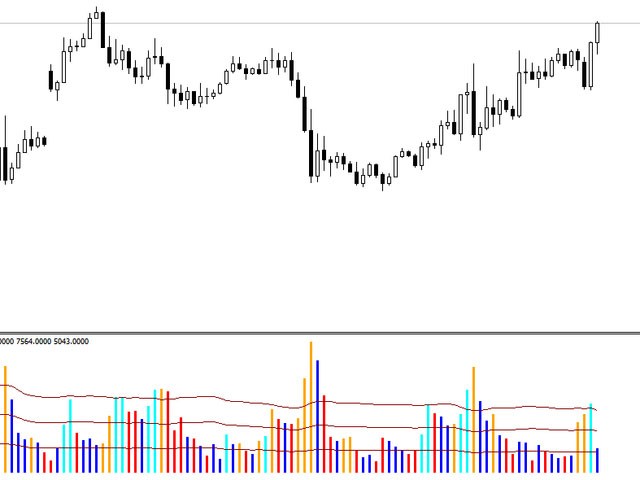
Der Volumenimpuls VSA-Indikator zeichnet ein Histogramm des Volumens unter Berücksichtigung der Balkenrichtung und vergleicht es mit dem Volumen der vorherigen Balken. Das Volumen des steigenden und des fallenden Trends wird in Blau bzw. in Rot dargestellt. Wenn das aktuelle Volumen das Volumen der Gegenrichtung übersteigt, wird ein Impuls gebildet. Dementsprechend werden die Impulse des Aufwärts- und Abwärtstrends in Blau und Orange dargestellt. Außerdem zeigt der Indikator drei Stufen an, anhand derer Sie die Volumina leicht vergleichen können. Die Analyse des Volumens hilft, den aktuellen Markttrend zu erkennen. Der Indikator ist nützlich für Händler, die beim Handel die VSA-Methode verwenden. Mit Hilfe des Indikators können Sie leicht mögliche Rücksetzer während der Korrektur sowie den Beginn, das Ende und die Umkehr des Trends bestimmen. Die Kombination von Volume Impuls VSA mit dem ProfileVolumesMarket-Indikator für Volumenkonzentrationen bietet ein leistungsfähiges Werkzeug für den volumenbasierten Level-Trading.
Einstellbare Parameter
- PeriodAutoFit - wenn auf "true" gesetzt - Periode der Levels für den Vergleich der Indikatorvolumina 24 Stunden
- VSA_Period - Periode für die Berechnung der Niveaus des Indikator-Volumenvergleichs in Bars, wenn PeriodAutoFit = false
- ShowOfBars - Anzeigetiefe der Indikatorhistorie