Profit Factor
- Indicadores
-
Dmitriy Moshnin
 Торговать нужно так, чтобы не было мучительно больно за бесцельно вложенные деньги...
 - Versión: 1.2
- Actualizado: 17 noviembre 2021
- Activaciones: 5
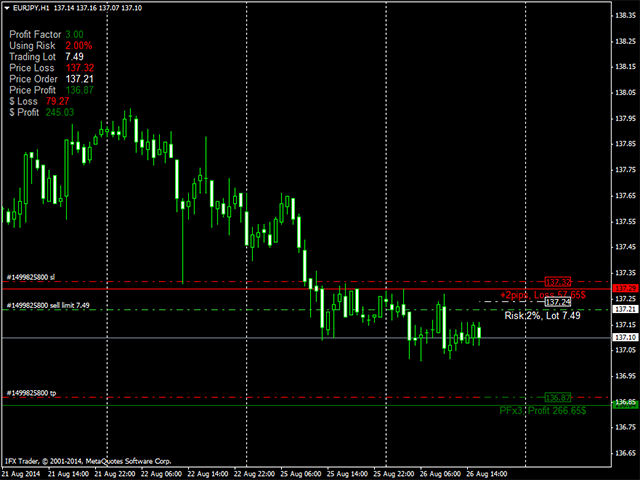
El indicador Profit Factor calcula uno de los tres parámetros: 1 - el nivel de entrada en el mercado (en el parámetro 'Calcular el' - Precio de apertura de la orden), 2 - el nivel de Stop Loss (Calcular el - Precio de pérdida del mercado), 3 - el nivel de Take Profit (Calcular el - Precio de ganancia del mercado) - con una relación deseada de ganancia/pérdida (Factor de ganancia), así como el tamaño del lote (volumen de la operación) de acuerdo con el valor del porcentaje de riesgo de los fondos disponibles especificados en la configuración (un análogo más simple es el indicador Cálculo del lote ). El indicador proporciona el sistema incorporado de notificaciones de alcanzar los niveles de Stop Loss (línea horizontal roja), Take Profit (línea horizontal verde) y precio de apertura de la orden (línea horizontal blanca) por el precio de mercado.
Parámetros
- Idioma Ruso - seleccione el idioma: Ruso/Inglés;
- Profit Factor - ratio de beneficio/pérdida según la estrategia (cualquier valor... 2/1, 2.5/1, 3/1, etc.);
- Porcentaje de Riesgo - valor porcentual de los fondos disponibles para calcular el tamaño del Lote;
- Calculate the - selección del modo de funcionamiento del indicador, cálculo del nivel de apertura de la posición basado en el Market Price Profit y Market Price Loss, o cálculo del nivel debeneficio objetivo basado en los precios especificados de Market Open Trade y Market Price Loss, o cálculo del nivel de Stop Loss basado en los precios especificados de Market Open Trade y Market Price Profit.
- Market Price Profit - Take Profit, precio de mercado; si el valor es igual a cero, el nivel se establece arrastrando con el ratón la línea horizontal de Nivel Take Profit en la ventana del gráfico;
- Market Open Trade - apertura de posición; si el valor es igual a cero, el nivel se establece arrastrando la línea horizontal de Level Open Trade en la ventana del gráfico utilizando el ratón;
- Market Price Loss - Stop Loss, precio de mercado; si el valor es igual a cero, el nivel se fija arrastrando con el ratón la línea horizontal de Level Stop Loss en la ventana del gráfico;
- Añadir Stop Loss (pips) - valor en pips añadido al precio del Stop Loss, se tiene en cuenta si el Precio de Mercado de Pérdida no es igual a cero.
- Línea ASK - añadir/eliminar la línea ASK.
Aplicación
Primero, defina sus objetivos, por ejemplo Take Profit y Stop Loss, e introduzca estos datos en los campos de los indicadores Market Price Profit y Market Price Loss. El Stop Loss puede fijarse con una pequeña tolerancia AddStopLoss (pips). Con el siguiente tick, el indicador dibuja las líneas ASK y el nivel horizontal de apertura de posición en forma de relación Beneficio/Pérdida, así como calcula el volumen de operación (si el Margen es insuficiente, se realiza el cálculo para el lote mínimo) y las posibles pérdidas y ganancias en la divisa de depósito.
Nivel Calculado Nivel de Apertura (blanco) es un nivel de apertura de la posición (o nivel de ajuste de Stop/Límite), por debajo del cual se muestra el volumen estimado de la operación. Si Market Price Profit y Market Price Loss se dejan en blanco , el indicador calculará el valor entre las líneas horizontales que se arrastran en la ventana del gráfico con el ratón.
Los datos del cálculo se muestran en la esquina superior izquierda de la ventana principal. Tenga en cuenta que el indicador tiene en cuenta el spread del símbolo seleccionado, Stop Loss y Take Profit para posiciones de venta se fijan en la línea ASK del indicador Line ASK SL y Line ASK TP.
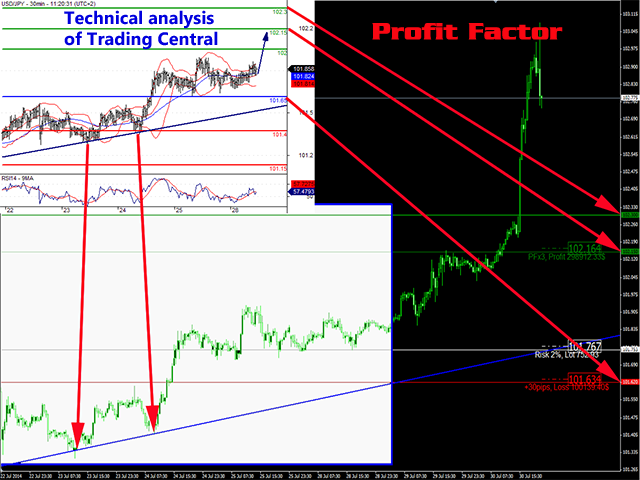
Si usted no tiene suficiente experiencia, puede utilizar el análisis técnico proporcionado por Trading Central (el indicador ha sido desarrollado para las previsiones de Trading Central) - el líder de la analítica global.
- Stop Loss se establece después de la línea de pronóstico azul o después del nivel opuesto más cercano con una pequeña (Añadir Stop Loss (pips) asignación a la Línea ASK SL del indicador para una posición de venta y Stop Loss de Nivel para una posición de compra;
- El Take Profit se fija en el Line ASK TP del indicador para una posición de venta y en el Level Take Profit para una posición de compra.
- En este caso, se coloca una orden pendiente con un Lote de cálculo a la línea de Nivel Open Trade.
Abra tres posiciones en diferentes símbolos mediante órdenes pendientes utilizando una relación Beneficio/Pérdida igual a 1/3. Siga el pronóstico actualizado una vez cada dos horas. La matemática es simple: si utiliza el riesgo máximo del 2% del depósito, aumente su depósito en un 18% cuando se alcancen tres ganancias. Si las tres posiciones alcanzan pérdidas (ocasión muy rara), disminuya su depósito en un 6%. Si dos posiciones son rentables, mientras que una es deficitaria: 6%+6%-2%=10% del beneficio. Una rentable y dos con pérdidas +6%-2%-2%=+2%. Y así sucesivamente.
Borre las órdenes no utilizadas si el precio ha alcanzado el nivel de Beneficio o la previsión del símbolo ha cambiado. Cuando el precio alcanza el nivel Open Trade, puede abrir una orden al precio de mercado. Eso puede ser seguido a través de un teléfono móvil mediante la activación de la función de notificación de mensajes. Envíeme un mensaje privado si está interesado en las previsiones de la empresa Trading Central. Mis contactos se pueden encontrar en el perfil.
¡Buena suerte en el trading!