RBCI hist
- Indikatoren
- Version: 1.1
- Aktualisiert: 21 November 2021
- Aktivierungen: 5

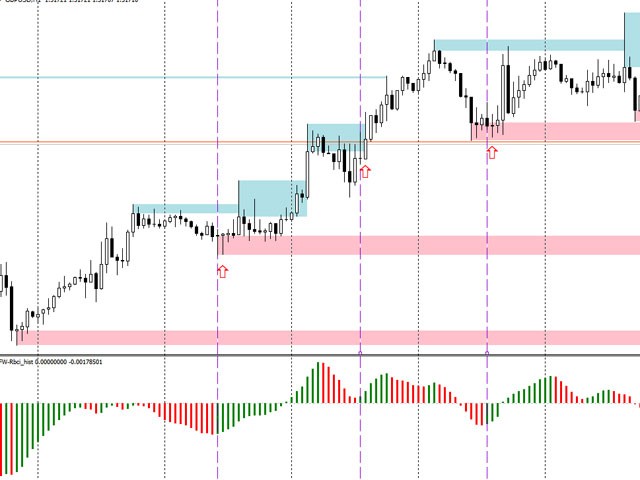
Der RBCI hist-Indikator ist ein adaptives Trend-Histogramm, das das Rauschen mit Hilfe eines Tiefpassfilters eliminiert, der die niedrigen Frequenzen durchlässt und die hohen Frequenzen der Kursschwankungen abschneidet.
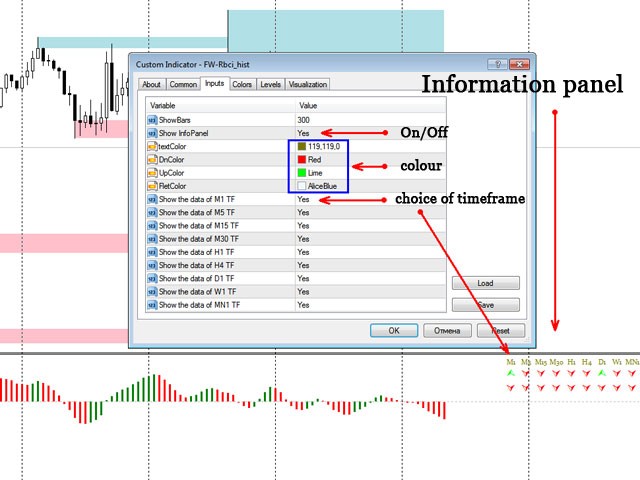
Das Signal (je nach der vom Händler gewählten Strategie) ist der Schnittpunkt der Nulllinie durch den Indikator sowie die Veränderung der Histogrammfarbe. Die Änderung der Histogrammfarbe dient als frühzeitiges Signal für die Eröffnung von Positionen in Richtung des Trends. Die Position des Indikators relativ zur Nulllinie zeigt die Stärke des aktuellen Trends an. Die Verfügbarkeit eines Informationsfensters, das die Informationen über den Indikator auf anderen Zeitrahmen anzeigt, ist eine gute Ergänzung während des Optionshandels oder des Handels durch Scalping. Die erste Zeile informiert über den aktuellen Trend, die zweite - über seine Stärke.
Einstellbare Parameter:
- ShowBars = 300 - Tiefe der Historie für die Anzeige des Indikators auf dem Chart;
- ShowInfoPanel = YES - Anzeige des Informationspanels;
- textColor - Farbe der Periode des Informationsfensters;
- DnColor - Farbe des Abwärtstrendsignals des Indikators;
- UpColor - Farbe des Aufwärtstrendsignals des Indikators;
- FletColor - Farbe des Aufwärts- und Abwärtstrend-Gleichheitssignals des Indikators;
- use_M1-use_MN1 = YES - zeigt Informationen über den aktuellen Zeitrahmen an;