VWAP Simple
- Indikatoren
- Version: 2.40
- Aktualisiert: 2 Juli 2021

Der volumengewichtete Durchschnittspreis ähnelt einem gleitenden Durchschnitt, mit dem Unterschied, dass das Volumen zur Gewichtung des Durchschnittspreises über einen bestimmten Zeitraum herangezogen wird.
Der volumengewichtete Durchschnittspreis [VWAP] ist ein dynamischer, gewichteter Durchschnitt, der den tatsächlichen Durchschnittspreis eines Wertpapiers über einen bestimmten Zeitraumgenauer widerspiegeln soll . Mathematisch gesehen ist der VWAP die Summe der getätigten Umsätze (d. h. Volumen x Preis) geteilt durch das Gesamtvolumen über einen beliebigen Zeithorizont, in der Regel vom Marktbeginn bis zum Marktschluss.
Der VWAP spiegelt die kapitalistische Demokratie des Marktes wider - eine Stimme pro Aktie, nicht eine Stimme pro Händler - und beschreibt ehrlicher das Konzept, das alle Händler implizit akzeptieren: dass der Markt von großen Teilnehmern gesteuert wird.
Institutionen nutzen ihn, um die Ausführungsqualität großer Geschäfte objektiv zu bewerten, während unabhängige Händler ihn als dynamische, ansonsten verborgene Unterstützung und Widerstanderleben , die am VWAP auftreten. Institutionelle Käufer und Algorithmen nutzen den VWAP oft, um Einstiege zu planen und größere Positionen zu eröffnen, ohne den Aktienkurs zu stören.
Der VWAP kann ähnlich wie gleitende Durchschnitte verwendet werden, wobei Kurse oberhalb des VWAP eine Hausse-Stimmung und Kurse unterhalb des VWAP eine Baisse-Stimmung widerspiegeln. Händler können Short-Positionen eröffnen, wenn der Aktienkurs für einen bestimmten Zeitraum unter dem VWAP liegt, oder Long-Positionen eröffnen, wenn der Kurs über dem VWAP liegt.
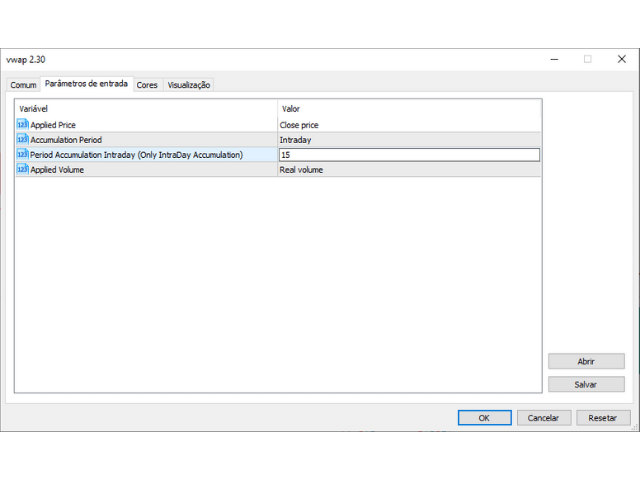
Parameter:
Angewandter Preis: PRICE_CLOSE = Schlusskurs
PRICE_OPEN = Eröffnungskurs
PRICE_HIGH = Der Höchstpreis für den Zeitraum
PRICE_LOW = Der Mindestpreis für den Zeitraum
PRICE_MEDIAN = Der Medianpreis, (Maximum + Minimum) / 2
PRICE_TYPICAL = Typischer Preis, (Maximum + Minimum + Schlusskurs) / 3
PRICE_WEIGHTED = Durchschnittspreis, (Maximum + Minimum + Schlusskurs + Schlusskurs) / 4
Kumulationszeitraum: TÄGLICH
WÖCHENTLICH
MONAT
KEINE
INTRADAY * Neue Funktion in 2.25v
Angewandtes Volumen: VOLUME_TICK
VOLUME_REAL
Period Accumulation Intraday: Int-Wert für die gewünschte Periode in Kerzen für die Akkumulation. ( Dies funktioniert nur mit der Akkumulationsperiode INTRADAY.)
Zum Beispiel, um VWAP für 60 Minuten, verwenden Sie Trimeframe 1 Minute und setzen Sie 60 Periode.
Puffer:
Dieser Indikator hat 2 Puffer.
1) Der erste ist der VWAP-Wert,
2) Der zweite ist Stag (Kerzenstrom. 0 ist die erste Kerze)
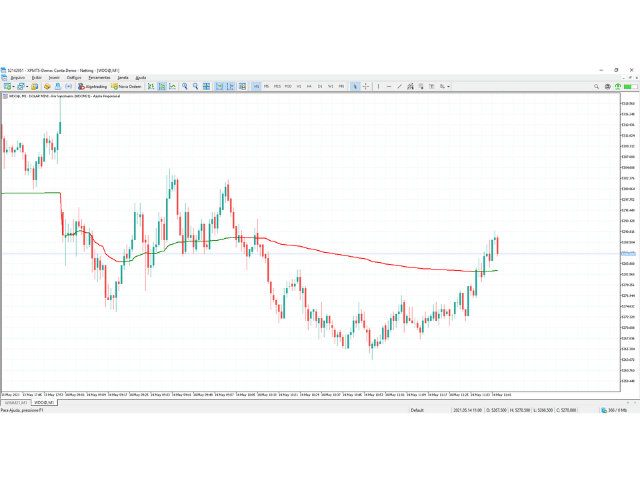


Funcionando bem no Mini Indice B3