YY Mono Waves MT5
- Indicatori
- Versione: 1.0
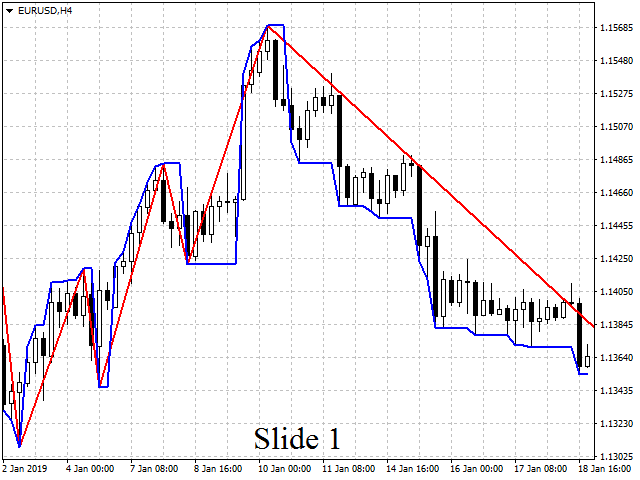
The Mono Waves indicator is designed to display the wave behavior of the market on a chart. Its appearance is presented on slide 1. This indicator uses the PPPC (Point-Percent Price Channel) indicator, which can be downloaded for free from the Market.
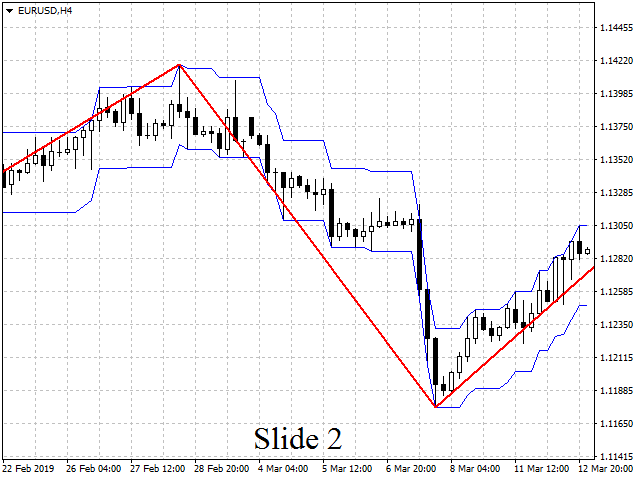
When the market moves up, the upper border of the price channel is built on High candlestick prices (for more details, see the description of the PPPC indicator at the link given above). The higher the High prices rise, the higher the PPPC indicator channel rises. In this case, one segment of the Mono Waves indicator line is drawn, which is directed upwards, and which connects two points: the lowest and highest points of the plot on which the PPPC channel rises. See slide 2 (left side).
As soon as the price touches the lower border of the channel, the PPPC indicator switches to building now this lower border, which is built at the price of Low candles. And the lower the Low prices fall, the lower the channel of the PPPC indicator falls. At the same time, a new segment of the Mono Waves indicator line is drawn, which is directed in the opposite direction (down), and which also connects two points: the highest and the lowest point of the plot on which the PPPC channel goes down. See slide 2 (middle part).
When the price touches the upper boundary of the channel, the PPPC indicator again switches to constructing this upper boundary. And the Mono Waves indicator is building a new segment of its line, which is again upward. And so on ... See slide 2 (right side).
Since the Mono Waves indicator is completely dependent on the operation of the PPPC indicator, it has exactly the same parameters as the latter.
Parameters
- Channel Width in Points – channel width in points;
- Channel Width in Percents – channel width in percents.
For the purpose of these parameters, see the description of the PPPC indicator, the link to which is given above.
Track lines
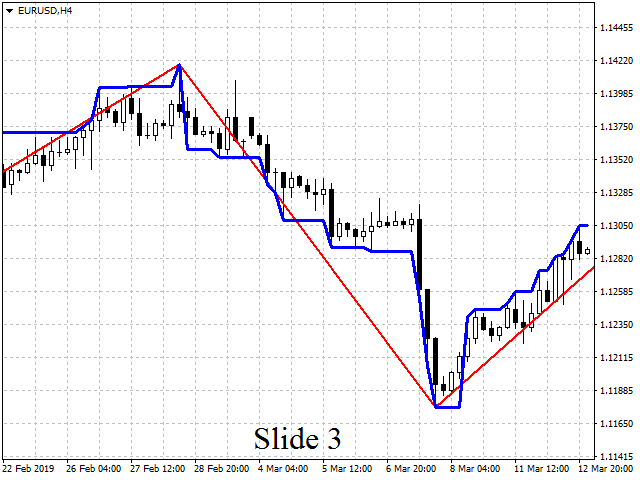
In addition to the main monowave line, this indicator has track lines. At the first start of the indicator, they are not visible. But they can be turned on (visualized) by specifying for them a color other than transparent, for example, blue. After they are turned on, the indicator will look like shown in slide 3.
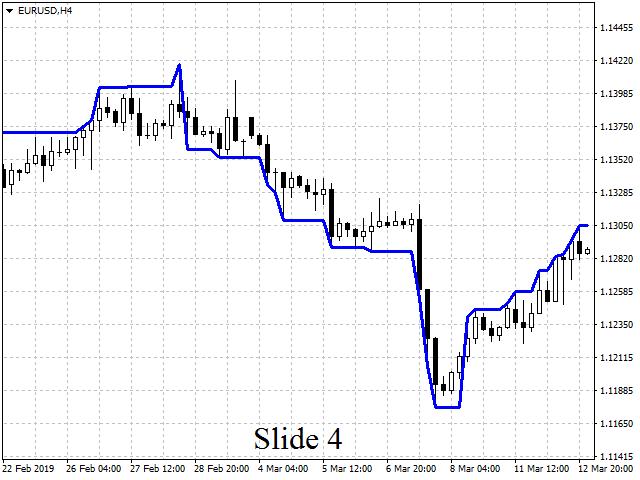
Why are these lines needed? There are at least three reasons to see them on the chart. First, these lines show the trajectory along which the right end of the mono-wave line segment moves in the process of its formation (as new bars appear). In fact, the lines of the track - this is the real mono-wave line. This is especially evident if you turn off the display of the main mono-wave line (by switching its color to transparent), while leaving only the display of the lines of the track. See slide 4.
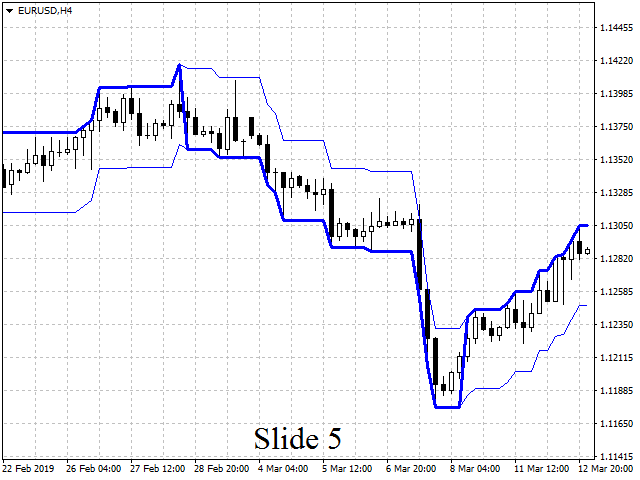
Secondly, the track lines show the moments at which a mono-wave line breaks, i.e. the construction of the previous segment is stopped and the construction of a new (oppositely directed) segment begins. To see this better, add the PPPC indicator price line display to the track lines. See slide 5. On this slide, the lines (i.e. borders) of the price channel are shown by thin blue lines, and the lines of the track by thick blue lines. As you can see on this slide, the lines of the track always move along one of the boundaries of the channel (either upper or lower).Sometimes track lines jump from one channel boundary to another. So, at the moment of such jumping, the mono-wave line breaks: i.e. the construction of the previous segment stops and the construction of a new (oppositely directed) segment begins. For example, when the track lines jump from the lower to the upper boundary of the channel, the construction of the previous (downward) segment of the mono-wave line stops, and the construction of a new segment upward begins.
Thirdly, the lines of the track can be bifurcated, thereby showing ... (see continued description on the Comments tab).
Unfortunately 2 indicators cannot appear on the same Tester chart, but the anyway, I prefer the price channel indicator for its breakout indication.
By the way, both indicators you are talking about are free. This means that no one bothers you to download and install them on the same chart (on a regular chart, not a tester one!). If you set the M1 timeframe on this chart, and in the parameters of both indicators specify the channel width (in points) approximately equal to the average candlestick size, then you will see the simultaneous operation of these indicators in real time (or, as you say, 'live').