Crazy Dancing Levels
- Göstergeler
- Sürüm: 2.21
- Etkinleştirmeler: 5

Crazy Dancing moving RES/SUP Levels
Automatic redrawing of moving Supports and resistances levels
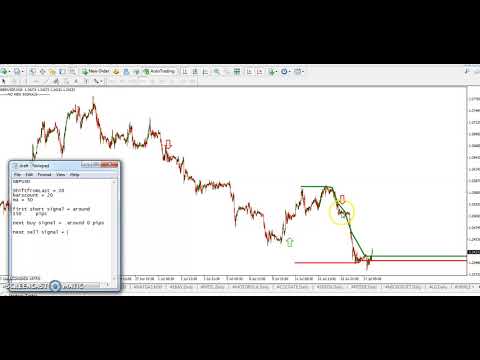
to indicate price breaking supports (signal SELL)
or breaking resistance levels (signal BUY)
Very simple appearing indicator but very clever and smart too !!!!
Main Inputs:
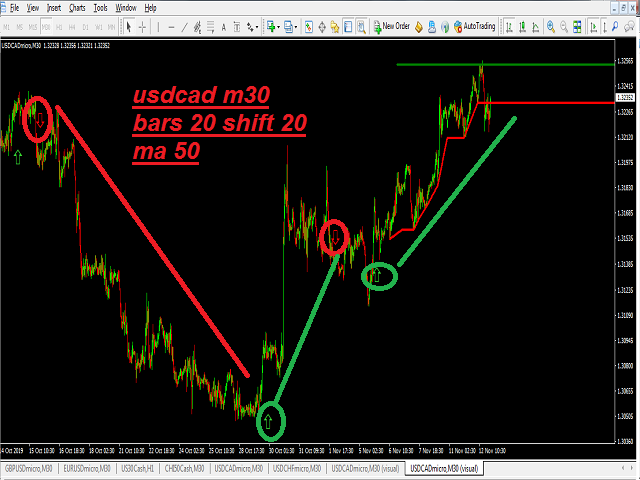
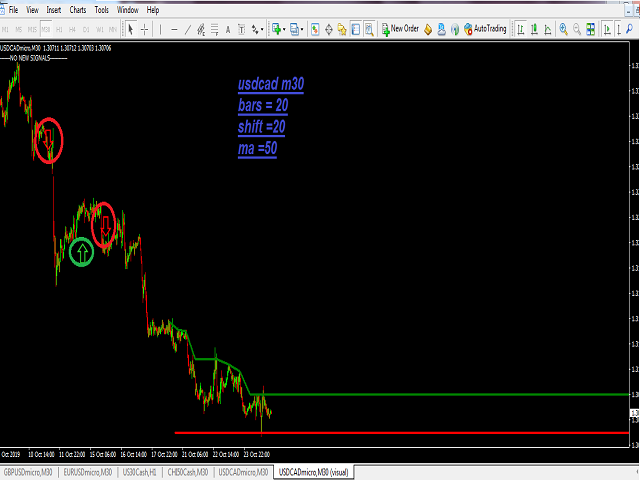
# of bars for the support and resistances levels + the initial shift from start + moving average for filter signaling
Smaller values for bars /shift inputs when using Higher Time frames (D1-H4) and the reverse higher values for lower time frames (M30-M5)
* an Arrow UP/Down in case of Bear/Bull market opportunities
* you can also manage the colors of the sup /res moving levels
* ALERTS enable/disable
A very helpful and smart indicator for all time frames and All symbols
MY FAVOURITE SETTINGS:
H1: Bars count = 5to 20; ShiftFromStar = 10-20; MA = 25
M30: Bars count = 10to40; ShiftFromStar = 25-50; MA = 50
M1: Bars count = 500 -1000; ShiftFromStar = 500-1000; MA = 1000
You will find the best combinations of inputs that suits you trading stategy !!