Buy Sell Heatmap
- Indikatoren
-
Shailesh Mishra
 Applied Physicist by training. Currently a full time Binary Options trader. :)
Highly intrested in technicals. - Version: 1.0
- Aktivierungen: 5
Einführung
Dies ist ein volumenbasierter Indikator vom Typ Heatmap. Der Indikator wird nicht neu gezeichnet. Er gibt eine kollektive Ansicht der kurz-, mittel- und langfristigen Volumen-Kauf-Verkauf-Aktivitäten (von unten nach oben). Dieser Indikator sollte sich als sehr nützlich für alle erweisen, die an die Macht der Volumina glauben. Wie bei volumenbasierten Indikatoren üblich, wird ein ECN-Broker empfohlen, der sowohl für den Binär- als auch für den Devisenhandel nützlich sein kann.
Bevor Sie sich fragen, wie Sie ihn verwenden können, sollten Sie wissen, dass der Indikator zwei grundlegende Erkenntnisse über den Markt bestätigt.
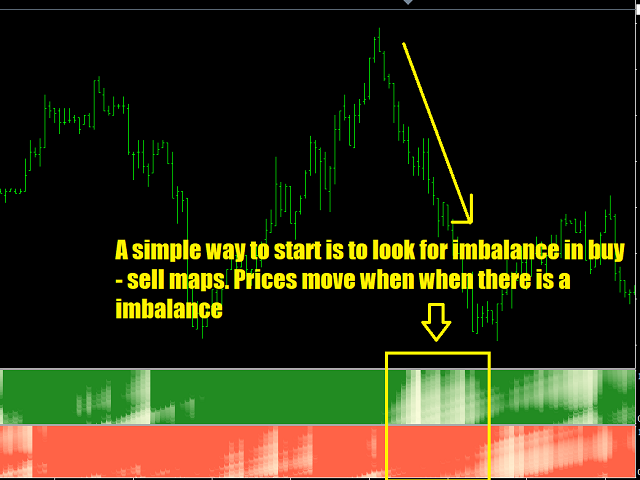
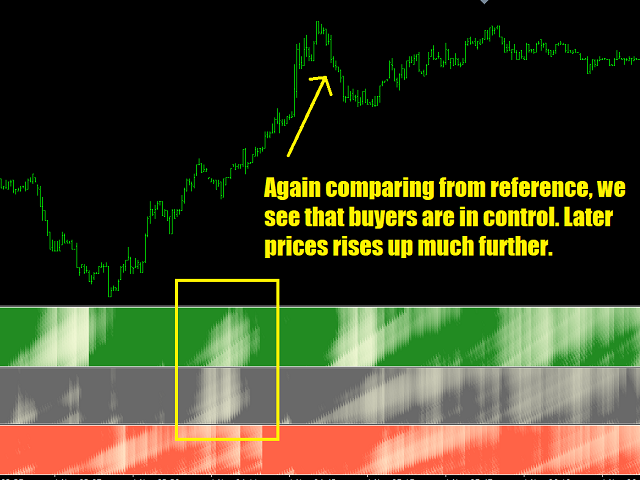
- Das Volumen geht der Preisbewegung voraus. Oder anders ausgedrückt: Das Volumen ist die Ursache und die Kursbewegung ist die Wirkung. Noch einfacher ausgedrückt: Die Volumenaktivität beginnt vor der großen Preisbewegung. Der Effekt wird in den Screenshots deutlich demonstriert, und allein diese Beobachtung kann einen großen Unterschied in Ihrem Handel ausmachen.
- Zyklusbrechung der Märkte. Es ist allgemein bekannt, dass sich die Märkte in Zyklen bewegen. Was macht es dann so schwierig, zu handeln? Was dieser Indikator ebenfalls beweist, ist, dass es zwar einen Zyklus im Marktvolumen gibt (Händler folgen einem regelmäßigen Zyklus), aber dass es etwas Grundlegenderes gibt, das die Umwandlung von Volumenzyklen in Preiszyklen unterbricht: Man kann sehen, dass es trotz des Zyklus in der Händleraktivität keinen Zyklus im individuellen Kauf-Verkaufsmuster gibt. Dies ist der wichtigste Grund für die Unterbrechung des Marktzyklus.
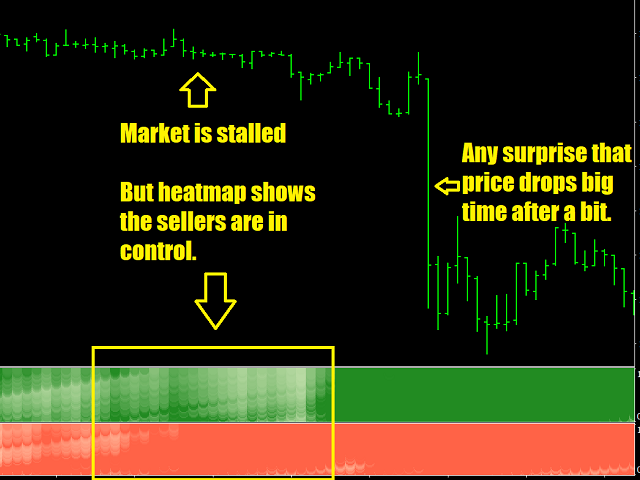
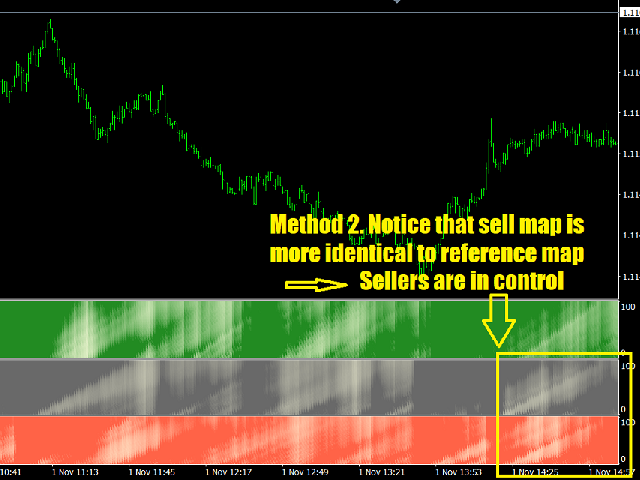
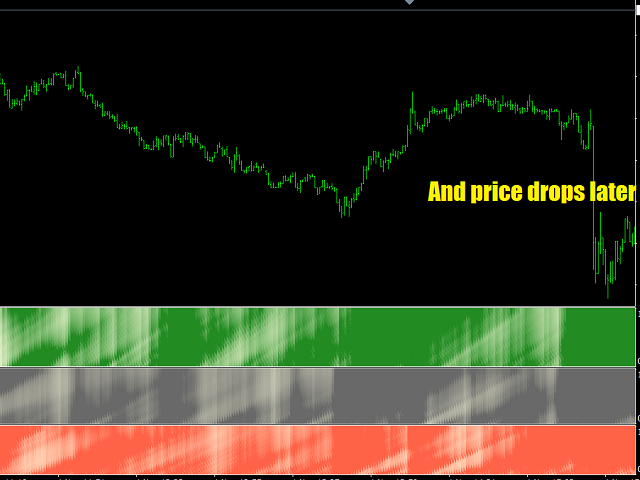
- Wer hat die Kontrolle über den Markt: Käufer oder Verkäufer? Ob ein festgefahrener Markt nach oben oder unten ausbricht, hängt davon ab, wer tatsächlich die Kontrolle über den festgefahrenen Markt hat. Dieser Indikator zeigt einen einfachen Weg, dies zu erkennen (in Screenshots erklärt)
Wie wird der Indikator verwendet?
Der Indikator ist sehr anschaulich und bietet Informationen auf einen Blick. Es gibt viele Möglichkeiten, ihn zu verwenden (z.B. um das Ungleichgewicht zwischen Kauf und Verkauf oder die Schwäche von Käufern oder Verkäufern zu erkennen, erschöpfende Bewegungen usw.) Die Volumenanalyse durch diesen Indikator liefert sehr wichtige Informationen zu den normalen Analysemethoden, die man verwenden würde.
Die Einstellungen des Indikators
- Für das Symbol - für den aktuellen Chart leer lassen
- Welches Volumen soll verwendet werden? - Wählen Sie zwischen Gesamtvolumen und individuellem Kauf- oder Verkaufsvolumen
- Durchschnittszeitraum des Volumens - Wählen Sie einen geeigneten Durchschnittszeitraum, wenn Sie sowohl die Kauf- als auch die Verkaufskarten mit der Gesamtvolumenkarte verwenden, ist es vielleicht besser, den Zeitraum der Kauf- und Verkaufskarte doppelt so lang wie den des Gesamtvolumens zu wählen, um die Konsistenz zu wahren.
- Mittelungsmethode - EMA, SMA, LWMA, geglättet
- Startzeitraum für Volumenmittelwerte - Wählen Sie den Startzeitraum aus, der im unteren Teil der Karte angezeigt wird.
- Endperiode für Volumendurchschnitte - Wählen Sie die Endperiode, die im oberen Teil der Karte angezeigt wird.
- Zu zeichnende Balken - Anzahl der zu berechnenden Balken
- Balkenbreite - Breite der Balken
- Eindeutige ID des Indikators - es ist hilfreich, eine andere ID zu wählen, wenn mehrere Instanzen des Indikators auf demselben Chart geladen sind
- Farbe für Aufwärts - Farbe für steigende Volumina
- Farbe für abwärts - Farbe für abnehmendes Volumen