Price River MT5
- Indikatoren
- Version: 2.5
- Aktualisiert: 20 November 2021
- Aktivierungen: 5

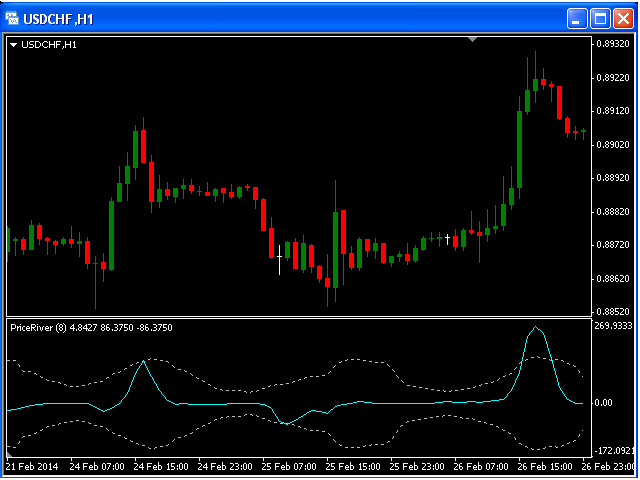
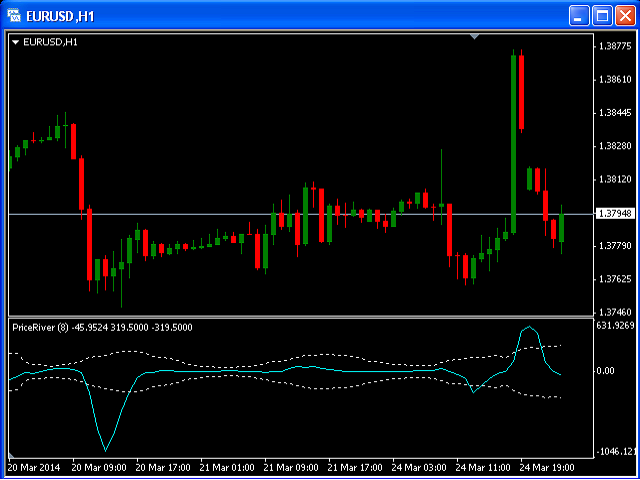
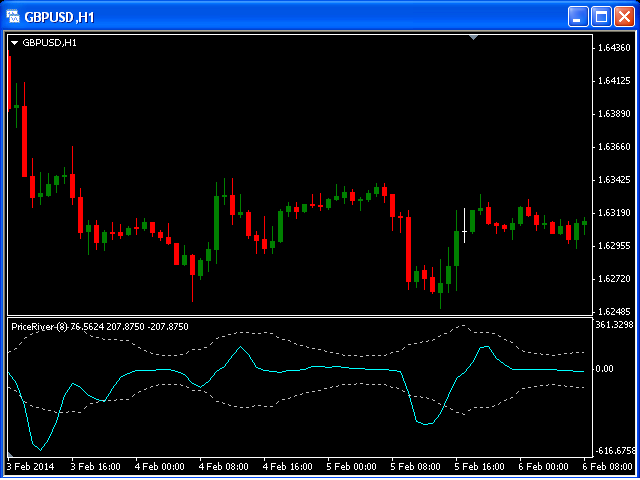
Der Indikator erstellt 2 Punktlinien, die ein oberes und ein unteres Band darstellen, und die Hauptlinie des Indikators, die Aqua-Linie, die die Preismacht darstellt.
Wenn die Hauptlinie innerhalb der Bänder schwimmt, sollten Sie abwarten und beobachten, bevor Sie in den Markt einsteigen.
Wenn die Hauptlinie aus oder in die Bänder springt, dann sollten Sie eine Long- oder Short-Position eingehen.