Quantum Dynamic Price Pivots Indicator for MT5
- Indicadores
- Versión: 2.0
- Actualizado: 6 enero 2025
- Activaciones: 5

Para los aspirantes a traders de acción del precio, la lectura rápida de un gráfico de velas puede aprenderse, pero es una habilidad que lleva años perfeccionar. Para los menos mortales, se necesita ayuda, y aquí es donde el indicador Quantum Dynamic Price Pivots interviene para ayudar.
Al tratarse de un indicador adelantado basado exclusivamente en la acción del precio, el indicador proporciona señales claras y sencillas en abundancia, destacando los posibles retrocesos con eficacia clínica. Al igual que el volumen y el precio, los pivotes son otro indicador "predictivo" y un indicador adelantado del comportamiento del precio. Y éste es sólo el punto de partida del indicador "navaja suiza".
Los puntos pivote pueden utilizarse para identificar fases de congestión en la acción del precio, ya que se crean de forma dinámica, así como para definir tendencias, también en tiempo real. Sin olvidar, por supuesto, las posibles oportunidades de trading.
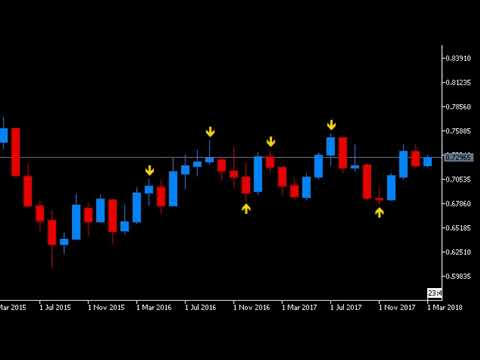
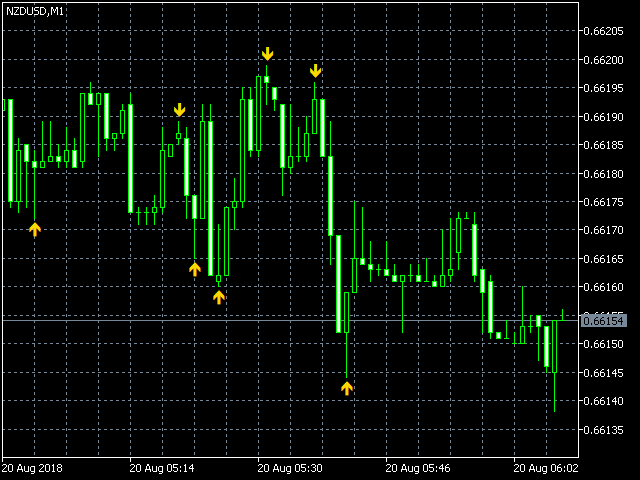
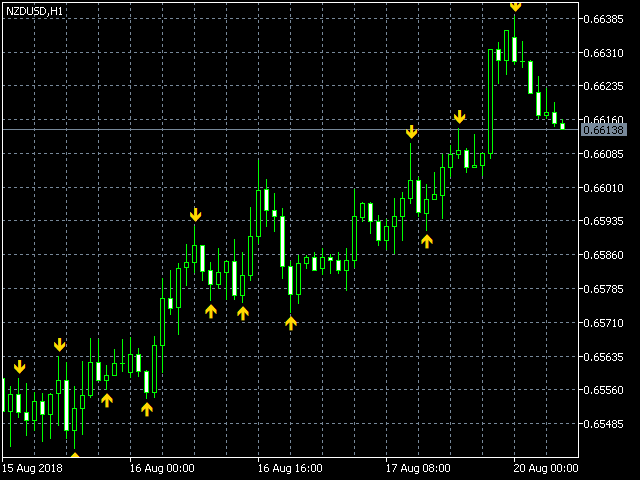
Se muestran dos señales de pivote específicas. Un pivote bajo y un pivote alto. Ambos se muestran con una flecha amarilla. El pivote bajo se activa en la vela, cuando las velas o barras a ambos lados tienen un máximo más alto y un mínimo más alto que el del centro. El pivote alto se activa en la vela, cuando las velas o barras a ambos lados tienen un máximo más bajo y un mínimo más bajo. Estas fases simples de la acción del precio señalan entonces posibles retrocesos junto con puntos de pausa en la congestión, y el desarrollo de tendencias a más largo plazo.
En las fases de congestión, los pivotes marcan los máximos y mínimos de la fase de forma dinámica. En la fase de tendencia, de nuevo marcan las líneas de tendencia superior e inferior a medida que se desarrolla la acción del precio.
Por eso lo llamamos el indicador de la "navaja suiza". Simple y elegante, pero potente y funcional con muchos usos. Y cuando se combina con el indicador Quantum Dynamic Support & Resistance, realmente le permite aprovechar estos puntos de inflexión clave de forma dinámica.
Consiga el suyo hoy mismo, ¡y olvídese del duro trabajo de operar con la acción del precio!