MOR Automatic Levels Building
- Indikatoren
- Version: 2.40
- Aktualisiert: 19 Februar 2018
- Aktivierungen: 10

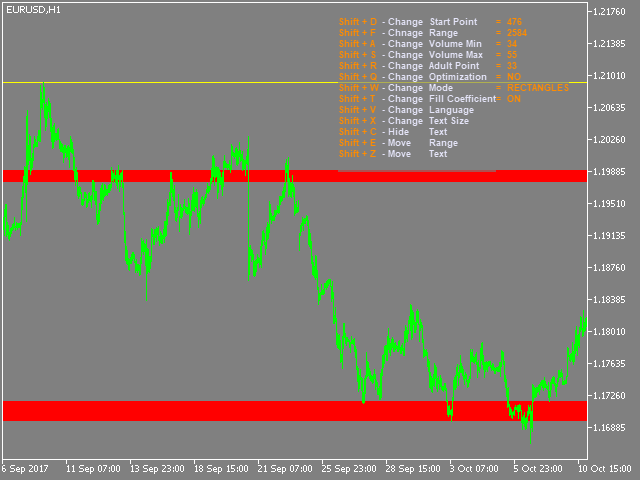
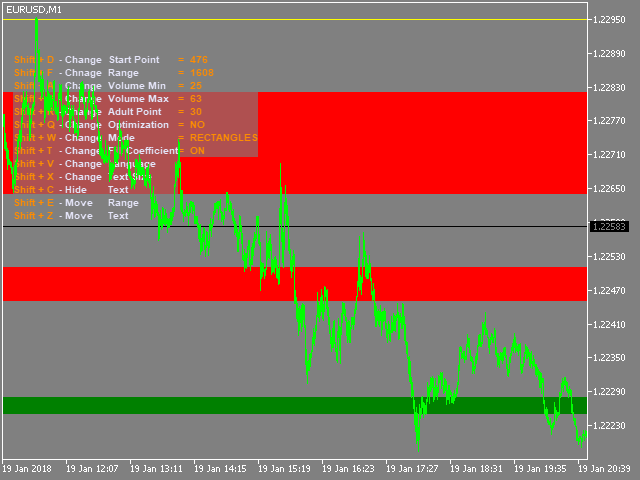
Dieser Indikator wurde entwickelt, um automatisch Unterstützungs-/Widerstandsniveaus zu bilden. Der Indikator berechnet die Dichte der Preisverteilung in der angegebenen Zeitspanne und erstellt eine Tabelle der Volumina für jeden Preis. Die Niveaus werden von den vom Benutzer angegebenen Mindest- bis zu den Höchstvolumina gebildet.
Einige Eingabeparameter können über Tastenkombinationen geändert werden, ohne dass das Einstellungsfenster geöffnet werden muss.
Eingaben
- Startpunkt - Nummer des Startbalkens
- Range - Länge des Levels in Takten (Zeitspanne)
- VolumeMin - minimale Lautstärke
- VolumeMax - maximale Lautstärke
- AdultPoint - wachsender Punkt in Prozent der Länge des Levels, der Standardwert ist 33%. Er wird verwendet, um die Lebensdauer eines Levels visuell zu verfolgen. Wenn das Niveau vor diesem Punkt erscheint, wird es als ungeeignet für den Handel betrachtet (junges Niveau), da es noch unvollständig sein kann (expandieren/verengen). Ist die Ebene später erschienen, gilt sie als handelstauglich (erwachsene Ebene).
- Optimierung - Optimierungsmethode:
- NEIN - die Optimierung ist deaktiviert, die Ebenen werden auf der Grundlage der vom Benutzer eingegebenen Daten erstellt
- GERADE - es werden Niveaus mit dem niedrigsten Volumen in Prozent der Breite der Preistabelle gebildet
- REVERSE - es werden die Ebenen mit dem größten Volumen in Prozent der Preistabellenbreite gebildet
- Modus - Stil der Darstellung
- RectangleFillKoefficient - aktiviert/deaktiviert das Rendering kleiner Ebenen (Rauschen), wenn der Rendering-Stil RECTANGLE eingestellt ist
- IndiсatorPeriod - Zeitrahmen, aus dem der Indikator Daten bezieht.
- LabelText - aktiviert/deaktiviert die Anzeige des Breitenwertes des Levels
- LabelTextSize - Textgröße
- ClrAdult - Farbe des Erwachsenen
- ClrYoung - Farbe eines jungen Levels
- ClrBefore - Farbe der Ebene, bevor sie erscheint
- ClrAdultHLine - Farbe der wachsenden Linie
- ClrStartHLine, ClrEndHLine, ClrHighLow - Farbe der Ebenengrenzen
- Canvas_Transparent - Transparenz des Hintergrunds der Hotkeys
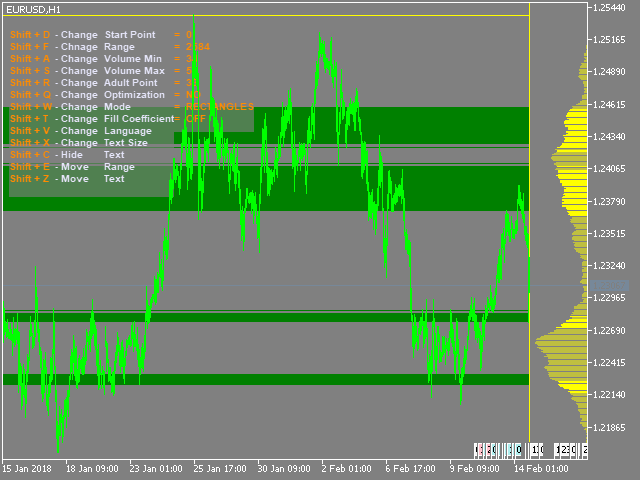
- DistributionWidth - Breite des Verteilungsdiagramms
- DistributionTransparent - Transparenz der Verteilungskurve
- DistributionColor - Farbe des Verteilungsdiagramms
- Distribution - Anzeige des Verteilungsdiagramms aktivieren/deaktivieren