MOR Automatic Levels Building
- Indicadores
- Versión: 2.40
- Actualizado: 19 febrero 2018
- Activaciones: 10

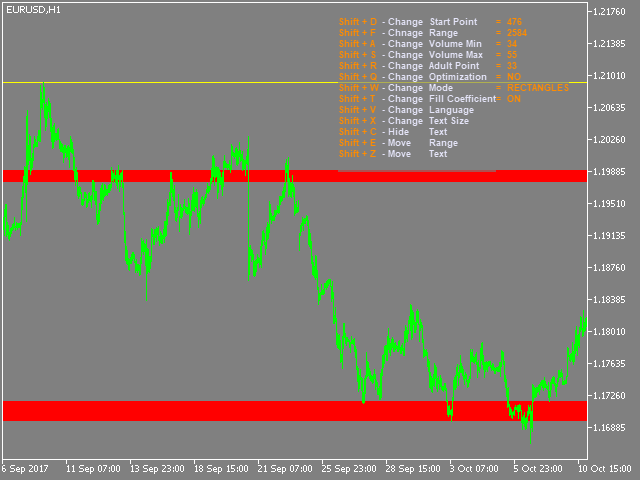
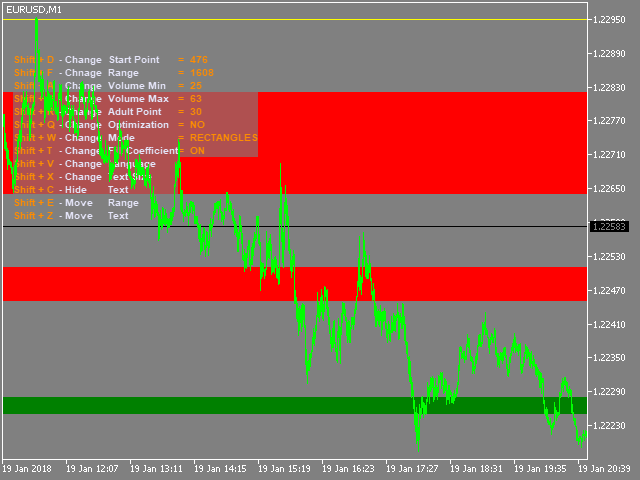
Este indicador está diseñado para construir automáticamente niveles de soporte/resistencia. El indicador calcula la densidad de la distribución de precios en el intervalo de tiempo especificado y crea una tabla de volúmenes para cada precio. Los niveles se construyen a partir de los volúmenes mínimos y máximos especificados por el usuario.
Algunos parámetros de entrada pueden modificarse mediante teclas de acceso rápido sin necesidad de abrir la ventana de ajustes.
Entradas
- Punto inicial - número de la barra inicial
- Rango - longitud del nivel en barras (rango de tiempo)
- VolumenMin - volumen mínimo
- VolumeMax - volumen máximo
- AdultPoint - punto de crecimiento en porcentaje de la longitud del nivel, el valor por defecto es 33%. Se utiliza para seguir visualmente la duración de un nivel. Si el nivel apareció antes de este punto, entonces se considera no apto para el comercio (nivel joven) ya que todavía puede estar incompleto (expandirse/estrecharse). Si el nivel apareció más tarde, se considera apto para el comercio (nivel adulto).
- Optimización - método de optimización:
- NO - la optimización está desactivada, los niveles se construyen en base a los datos especificados por el usuario.
- STRAIGHT - se construyen los niveles con el menor volumen en porcentaje de la anchura de la tabla de precios
- REVERSE - se construyen los niveles con el mayor volumen en porcentaje de la anchura de la tabla de precios
- Modo - estilo de representación
- RectangleFillKoefficient - habilita/deshabilita el renderizado de niveles pequeños (ruido) si se configura el estilo de renderizado RECTANGLE
- IndiсatorPeriod - marco de tiempo del que el indicador toma datos.
- LabelText - habilitar/deshabilitar la visualización del valor de anchura del nivel
- LabelTextSize - tamaño del texto
- ClrAdult - color de adulto
- ClrYoung - color de nivel joven
- ClrBefore - color del nivel antes de que aparezca
- ClrAdultHLine - color de la línea creciente
- ClrStartHLine, ClrEndHLine, ClrHighLow - color de los límites del nivel
- Canvas_Transparent - transparencia del fondo de las teclas de acceso rápido
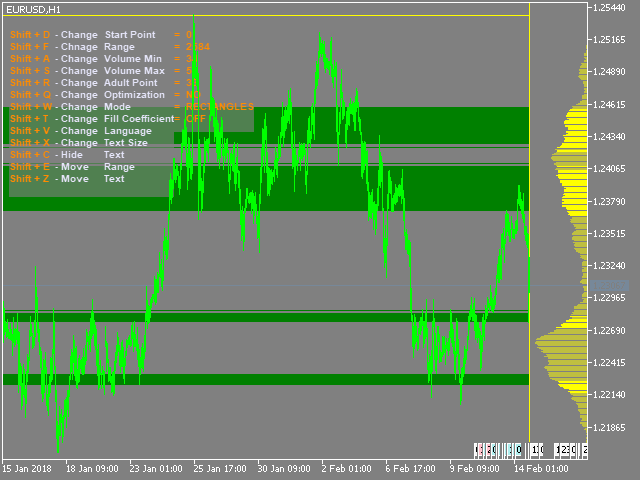
- DistributionWidth - anchura del gráfico de distribución
- DistributionTransparent - transparencia del gráfico de distribución
- DistributionColor - color del gráfico de distribución
- Distribution - activar/desactivar la visualización del gráfico de distribución