TimeFilter simple
- Indikatoren
- Version: 1.12
- Aktualisiert: 17 November 2021
- Aktivierungen: 5

Der Indikator ist ein stündlicher Filter für den Zeitraum zwischen zwei Wochen.
Bei der Durchführung von Handelsoperationen ermöglicht der Indikator die Berücksichtigung von Zeitmerkmalen der einzelnen Handelssitzungen.
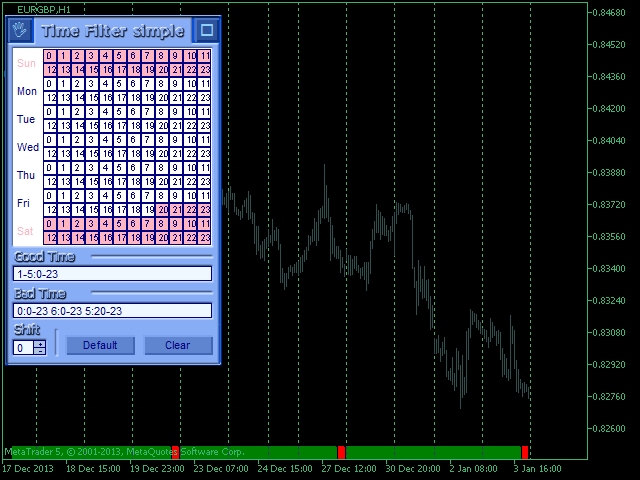
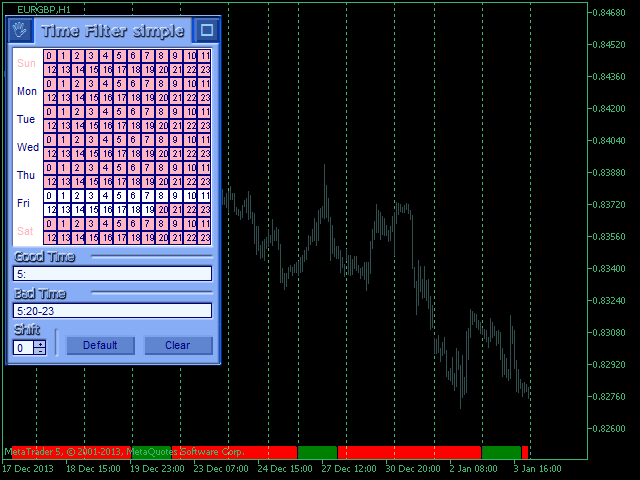
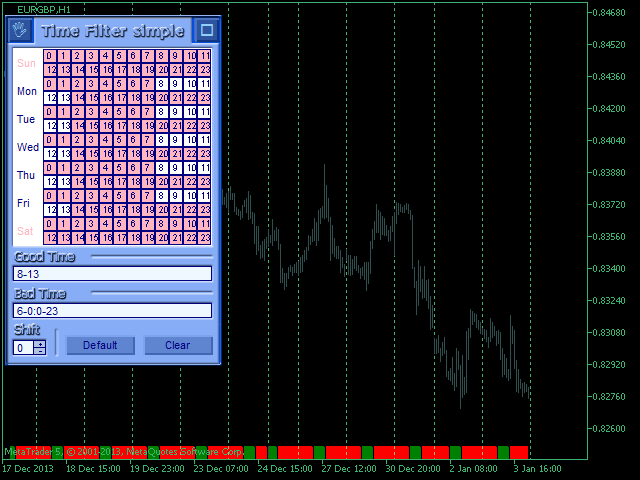
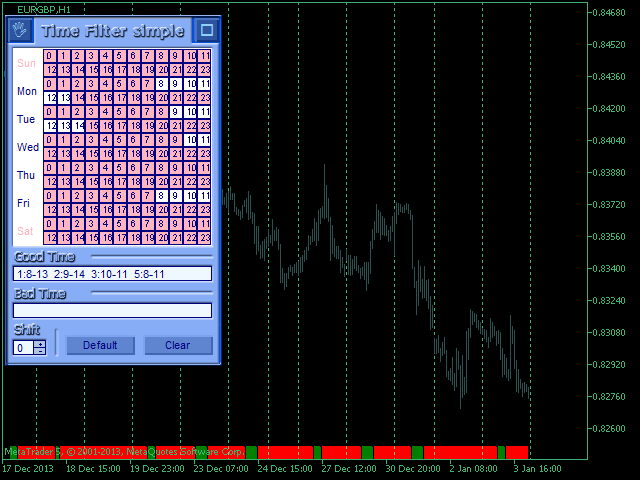
Die zulässigen und restriktiven Filterintervalle werden in Form von Strings festgelegt. Das verwendete Format ist [erster Tag]-[letzter Tag]:[erste Stunde]-[letzte Stunde]. Siehe die Screenshots für Beispiele.
Parameter:- Gute Zeit für den Handel - Intervalle, in denen der Handel erlaubt ist.
- Schlechte Zeit für den Handel - Intervalle, in denen der Handel untersagt ist.
- Zeitfilter Verschiebung (Stunden) - stündliche Verschiebung.
- Prozentuale Füllung - Anzeigewert.
- Show On/Off - aktiviert/deaktiviert die Filtervisualisierung.
Verwendung in Expert Advisors: Puffer 0 gleich 0 - Handel ist verboten, sonst - erlaubt.


Der Benutzer hat keinen Kommentar hinterlassen