Ticks Price Channel 4
- Indikatoren
- Version: 1.12
- Aktualisiert: 17 November 2021
- Aktivierungen: 5

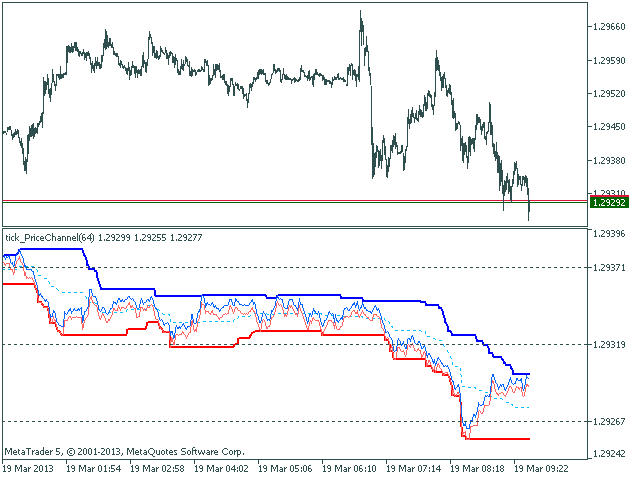
Der Price Channel-Indikator wird in einem Tick-Chart gezeichnet.
Nach dem Start warten Sie, bis genügend Ticks vorhanden sind.
Parameter:
- Periode - Periode für die Bestimmung der Kanalgrenzen.
- Anzahl der Kursniveaus - Anzahl der angezeigten Kursniveaus (bei Einstellung 0 werden keine Niveaus angezeigt).
- Preismodus - Auswahl der zu berechnenden Preise (kann Bid, Ask oder Average sein).
- Bar under calculation - Anzahl der Bars auf dem Chart für die Berechnung des Indikators.
Pufferindizes: 0 - oberer Kanal, 1 - unterer Kanal, 2 - mittlerer Kanal.