Ticks MACD 4
- Indikatoren
- Version: 1.12
- Aktualisiert: 17 November 2021
- Aktivierungen: 5

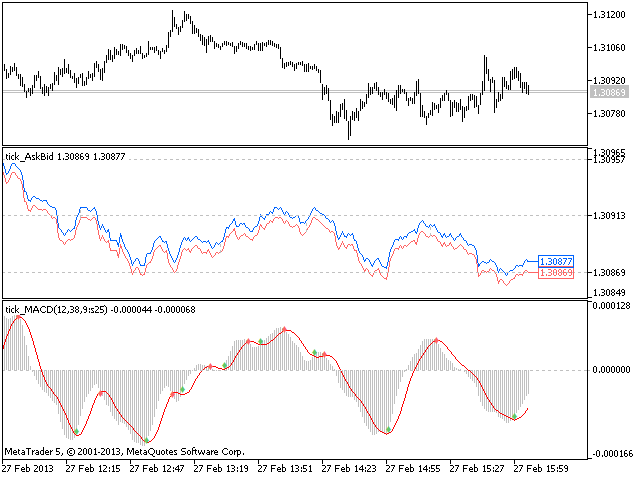
Der Indikator Moving Average Convergence/Divergence (MACD) wird in einem Tick-Chart gezeichnet.
Warten Sie nach dem Starten, bis genügend Ticks vorhanden sind.
Parameter:
- Schnelle EMA-Periode - Indikator wird in einem Tick-Chart gezeichnet.
- Langsame EMA-Periode - langsame Periode der Mittelwertbildung.
- Signal SMA Periode - Periode der Mittelwertbildung der Signallinie.
- Berechneter Balken - Anzahl der Balken im Chart für die Berechnung des Indikators.
Die folgenden Parameter dienen zur Einstellung der Gewichtung der MACD-Signale (von 0 bis 100). Ihre Beschreibung finden Sie in der Sektion Signale des MACD-Oszillators der MQL5-Referenz.
- Der Oszillator hat die gewünschte Richtung.
- Umkehrung des Oszillators in die gewünschte Richtung.
- Kreuzung der Haupt- und Signallinie.
- Kreuzung der Hauptlinie und des Nullniveaus.
- Divergenz zwischen dem Oszillator und dem Preis.
- Doppelte Divergenz des Oszillators und des Preises.
Pufferindizes: 0 - MACD_LINE, 1 - SIGNALLINE, 4- SIGNAL_UP, 5- SIGNAL_DOWN.