Ticks OsMA 4
- Indikatoren
- Version: 1.12
- Aktualisiert: 17 November 2021
- Aktivierungen: 5

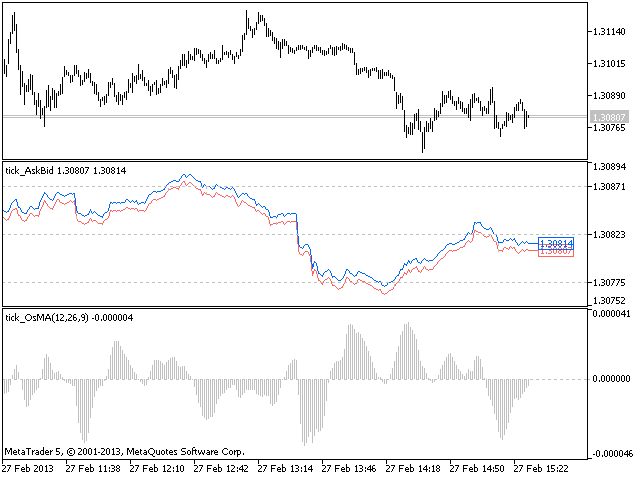
Der Indikator Gleitender Durchschnitt des Oszillators (OsMA) wird in einem Tick-Chart gezeichnet.
Nach dem Start warten Sie, bis genügend Ticks vorhanden sind.
Parameter:
- Schnelle EMA-Periode - schnelle Periode der Mittelwertbildung.
- Langsame EMA-Periode - langsame Periode der Mittelwertbildung.
- Signal SMA Periode - Periode der Mittelwertbildung der Signallinie.
- Berechneter Balken - Anzahl der Balken für die Berechnung des Indikators.