MTF CCI for MT5
- Indikatoren
- Version: 1.20
- Aktualisiert: 1 Dezember 2021
- Aktivierungen: 10

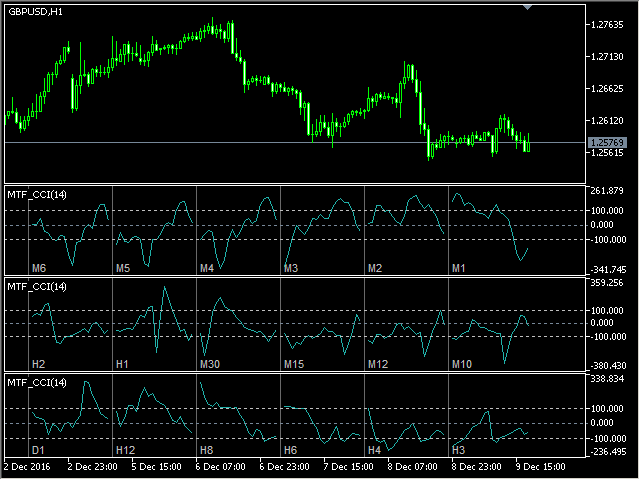
Der Multi-Timeframe-Indikator Commodity Channel Index zeigt Informationen aus verschiedenen Perioden gleichzeitig in einem Teilfenster des Charts an.
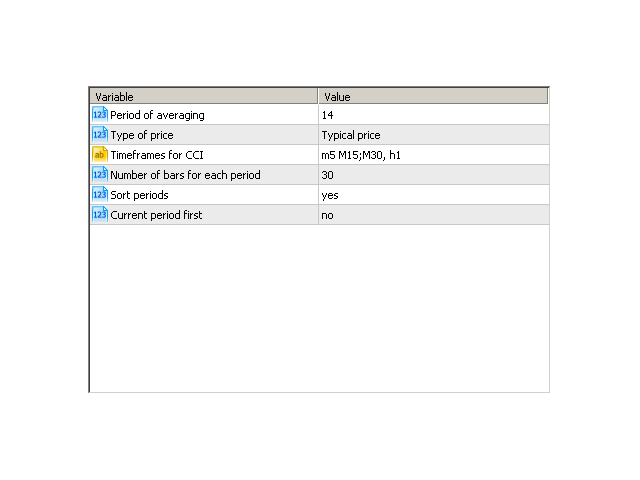
Parameter
- Periode der Mittelung - Mittelungsperiode für die CCI-Berechnung.
- Preistyp - verwendeter Preis.
- Zeitrahmen für den CCI - Liste der Perioden, getrennt durch ein Leerzeichen, Komma oder Semikolon.
- Anzahl der Balken für jede Periode - die Anzahl der Balken, die für jede Periode angezeigt werden.
- Zeiträume sortieren - sortiert die Zeiträume, wenn sie in keiner bestimmten Reihenfolge aufgelistet sind.
- Aktuelle Periode zuerst - zeigt die aktuelle Periode zuerst an.