MTF CCI for MT5
- Indicadores
- Versión: 1.20
- Actualizado: 1 diciembre 2021
- Activaciones: 10

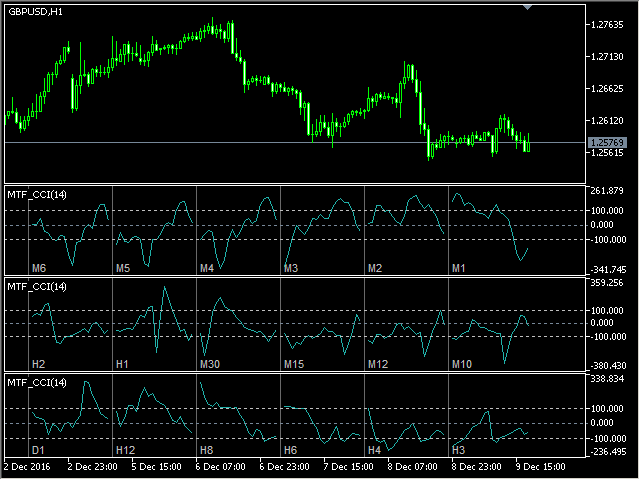
El indicador Multi-timeframe Commodity Channel Index muestra información simultánea de diferentes periodos en una subventana del gráfico.
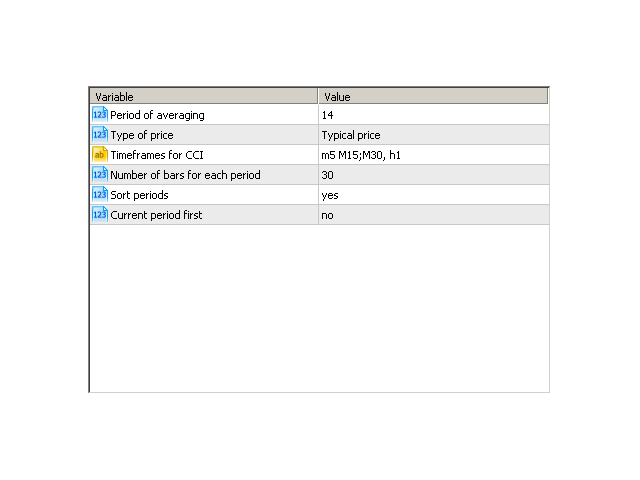
Parámetros
- Período de promediación - período de promediación para el cálculo del CCI.
- Tipo de precio - precio utilizado.
- Periodos para el CCI - lista de periodos, separados por un espacio o coma o punto y coma.
- Número de barras para cada periodo - número de barras mostradas para cada periodo.
- Ordenar periodos - ordenar los periodos si no aparecen en un orden determinado.
- Periodo actual primero - mostrar primero el periodo actual.