MAtsi
- Indikatoren
- Version: 2.8
- Aktualisiert: 30 Mai 2020
- Aktivierungen: 10

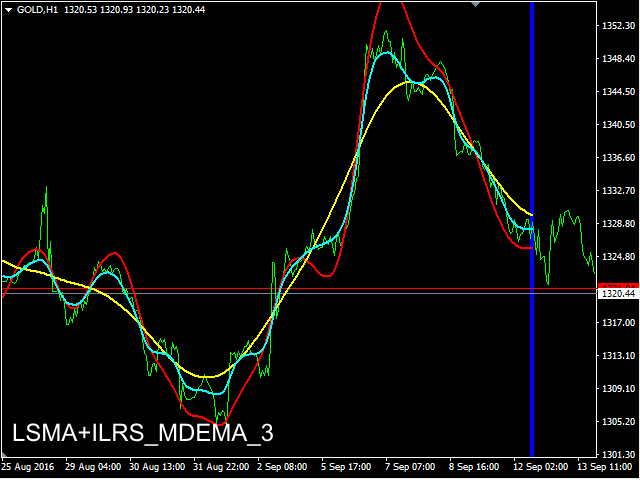
Professional 0 Lag MAs Trend Sensor Indikator
MAtsi ist ein Trend-Sensor-Indikator, bei dem 2 MA-s gleichzeitig arbeiten.
Er wurde entwickelt, um einen breiteren Bereich von dynamischen Trends abzudecken, in dem MAi nicht so effektiv ist.
Die enthaltenen Durchschnittswerte werden im Codeabschnitt des Indikators MAi beschrieben.
Der MAtsi-Indikator kann viele Instanzen für alle Zeitrahmen auf einmal ausführen, so dass Sie die Ergebnisse mit verschiedenen Einstellungen testen und vergleichen können.
Er ist sehr schnell und hat, wie alle unsere Indikatoren, eine eingebaute"Slider History Testing" Technologie.
Das Programm ist so konzipiert, dass es in 2 automatischen Modi arbeitet:
1. Schieberegler-Modus
Schaltet sich ein, wenn der Indikator an den Chart oder Visual Tester angeschlossen wird.2. Experten-Modus
Hier können Sie Ihre Einstellungen in der Historie mit dem "Schieberegler" bis zu 32767 Balken zurück testen/einstellen.
So können Sie beim visuellen Testen des EA den Indikator anhängen und die Eingabeparameter für kritische Punkte leicht anpassen.
Im Tester (nur) können Sie den "Schieberegler-Modus" durch Drücken der <Esc>-Taste verlassen.
Sie können ganz einfach zwischen den Zeitrahmen an der ausgewählten Position wechseln und die Ergebnisse vergleichen.
Bitte sehen Sie sich "Umschalten" in HD an . .. https://youtu.be/tAoB4FPTrRU
Schaltet sich ein, wenn der Indikator über den Experten mit der Funktion "iCustom" gestartet wird.
Er ist nur für den EA-Einsatz konzipiert und "Slider History Testing" ist deaktiviert.
Der Indikator ist mit einer "Fehlerkontrolle" ausgestattet, so dass Sie immer sehen können, was schief läuft und dies korrigieren können.
Er ist getestet und funktioniert sehr gut in unserem EA "PointerX".
Bitte sehen Sie sich den "Test" in HD an . .. https://youtu.be/2qh3qTaGVAE
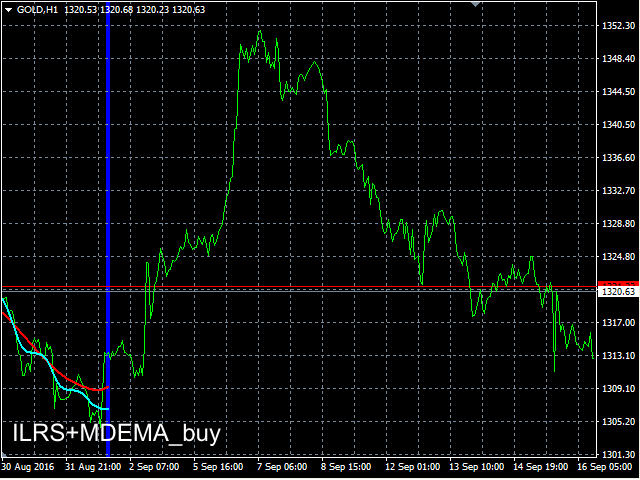
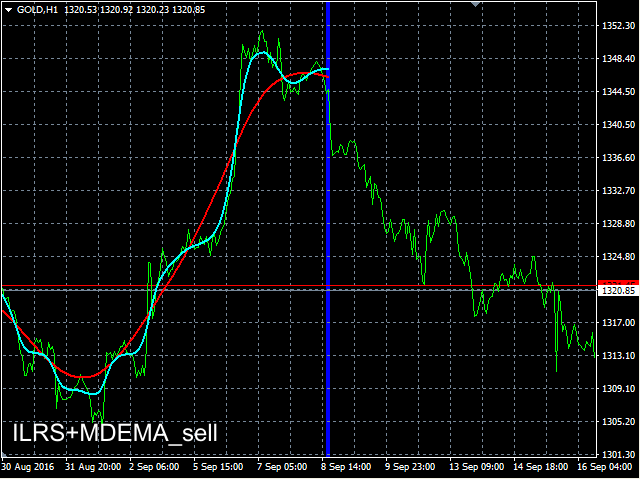
Wie kann man mit MAtsi handeln?
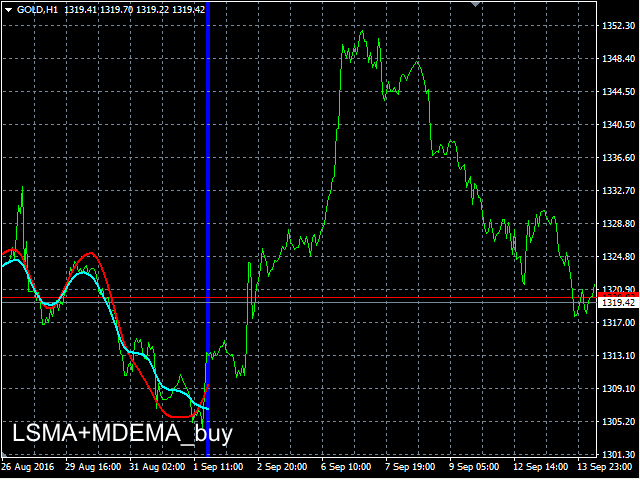
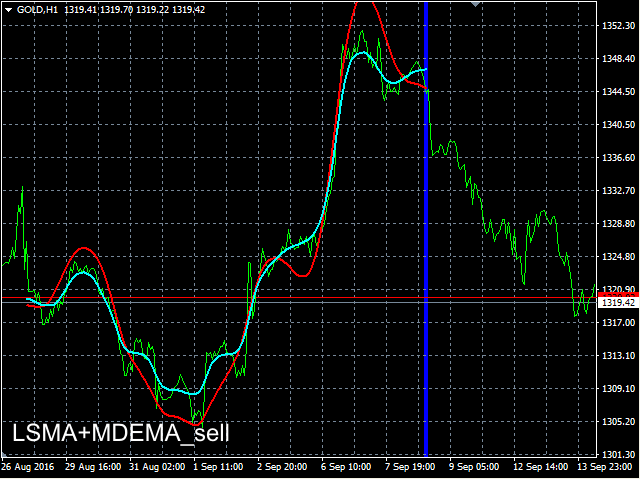
Wenn LINE_1 nach oben geht und über LINE_2 liegt, KAUFEN Sie, wenn LINE_1 nach unten geht und unter LINE_2 liegt, VERKAUFEN Sie.Sie haben auch einige andere Möglichkeiten (Verwendung in Kombination mit unseren Indikatoren, Verwendung in bestimmten anderen Indikatoren ...).
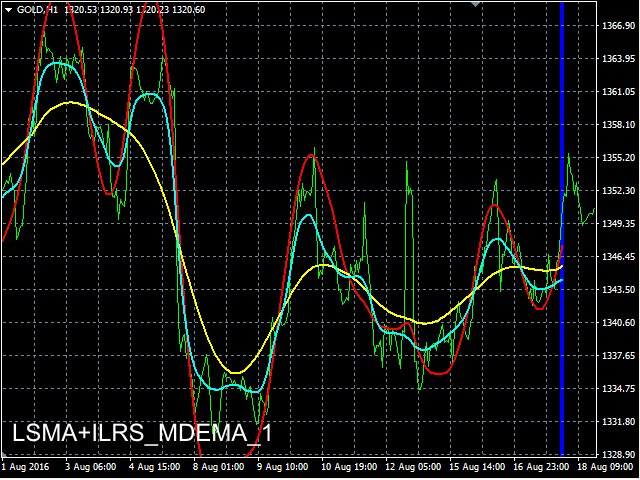
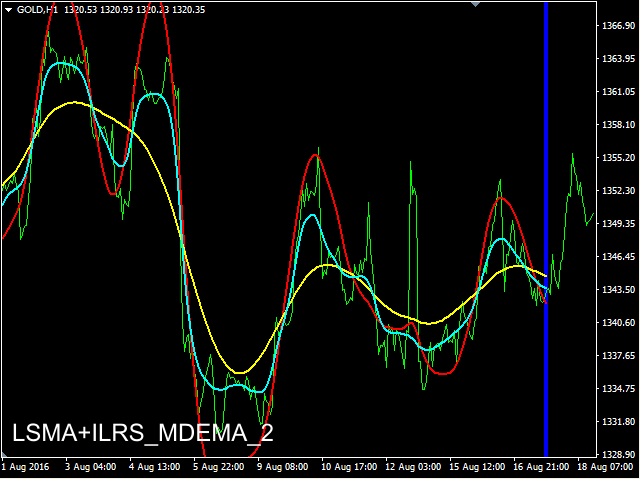
Wir empfehlen, mehrere Instanzen des Indikators auf verschiedenen Zeitrahmen mit verschiedenen Einstellungen für bessere Ergebnisse (M15, H1, H4) laufen zu lassen.
Für Programmierer
Sie können in EA-s "enum method" Code einfügen. (siehe Abschnitt MAiindicator-Code)Die bekannten Befehle zum Abrufen des aktuellen und vorherigen Wertes sind für MQL4:
double L1Cur=iCustom(NULL,MAtsi_TF_,"MAtsi",L1_MTD_,L1_st_,L1_sm_,L1_vf_,L1_lam_,L2_MTD_,L2_st_,L2_sm_,L2_vf_,L2_lam_,1,0,1);
double L1Prev=iCustom(NULL,MAtsi_TF_,"MAtsi",L1_MTD_,L1_st_,L1_sm_,L1_vf_,L1_lam_,L2_MTD_,L2_st_,L2_sm_,L2_vf_,L2_lam_,1,0,2);
double L2Cur=iCustom(NULL,MAtsi_TF_,"MAtsi",L1_MTD_,L1_st_,L1_sm_,L1_vf_,L1_lam_,L2_MTD_,L2_st_,L2_sm_,L2_vf_,L2_lam_,1,1,1);
if(L1Cur>L1Prev&&L1Cur>L2Cur) buyMAtsi_=true;
if(L1Cur<L1Prev&&L1Cur<L2Cur) sellMAtsi_=true;
wobei:
NULL = aktuelles Symbol
MAtsi_TF_ = enum_timeframes
"MAtsi" = Pfad/Name des kompilierten Programms des benutzerdefinierten Indikators
L1(2)_MTD_ = Zeile_1(2) Methode (von 0-16)
L1(2)_st_ = Zeile_1(2) Schritt
L1(2)_sm_ = Zeile_1(2) Glatt (Glätte der Linien)
L1(2)_vf_ = Linie_1(2) v_factor (Volumenfaktor)
L1(2)_lam_ = Linie_1(2) lambda
1 = letzter Balken (1 für genaue Ergebnisse, da Balken 0 normalerweise nicht abgeschlossen ist)
0(1) = Zeilenindex
1(2) = Verschiebung
MAtsi Eingabeparameter Einstellungen
Die Reihenfolge von links nach rechts ist: Name, [Standardwert], Min-Max-Wert.Wenn Sie versehentlich einen niedrigeren oder höheren Wert eingeben, wird der Min-Max-Wert verwendet.
- L1_method [LSMA] - line_1 Methode
- L1_step [35] 0-100 - line_1 step
- *L1_smooth [0] 0-100 - Glättung der Linie_1
- *L1_v_factor [1.0] 0.0-50.0 - line_1 Volumenfaktor
- *L1_lambda [0.3] 0.0-100.0 - line_1 lambda (nur für REMA, REMA_Hull aktiviert)
- L2_Methode [MDEMA] - Linie_2 Methode
- L2_step [8] 0-100 - Linie_2 Schritt
- *L2_smooth [0] 0-100 - line_2 Glättung
- *L2_v_factor [1.0] 0.0-50.0 - line_2 Volumenfaktor
- *L2_lambda [0.3] 0.0-100.0 - line_2 lambda (nur für REMA, REMA_Hull aktiviert)
- LastBar [0] 0-6000 - Zeichnen des letzten Balkens (links-rechts absteigende Reihenfolge, 0 ist der letzte)
- PastBars [100] 1-6000 - Zeichnen der Balken in der Vergangenheit (nach links)
*für bestimmte Methoden ist deaktiviert, je nach Art der MA-s
Zusätzliche Informationen
Die Demoversion von MAtsi , MAtsiDemo, dient der Demonstration der wichtigsten Funktionen und der Benutzerfreundlichkeit von MAtsi.
Wenn Sie MAtsi uneingeschränkt oder innerhalb eines EAs nutzen möchten, müssen Sie dieses Produkt kaufen oder mieten.
Sind Sie mit unserer Arbeit zufrieden? Teilen Sie Ihre Erfahrungen und hinterlassen Sie einen Kommentar.
Wenn Sie Hilfe bei der Nutzung unserer Trading-Tools benötigen oder ein Problem oder eine Frage haben, kontaktieren Sie mich bitte.
VLabs