CandleStick MT4
- Indikatoren
- Version: 1.3
- Aktualisiert: 5 September 2023
- Aktivierungen: 5

Was Sie mit CandleStick tun können
CandleStick ist ein nützlicher Indikator für die MTF-Analyse.
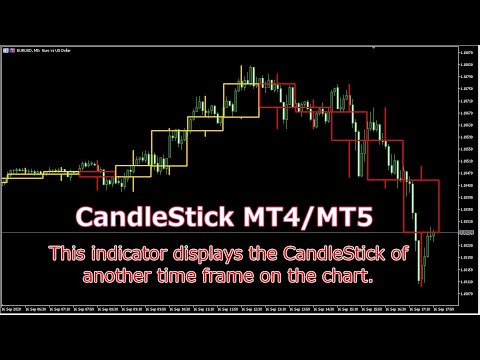
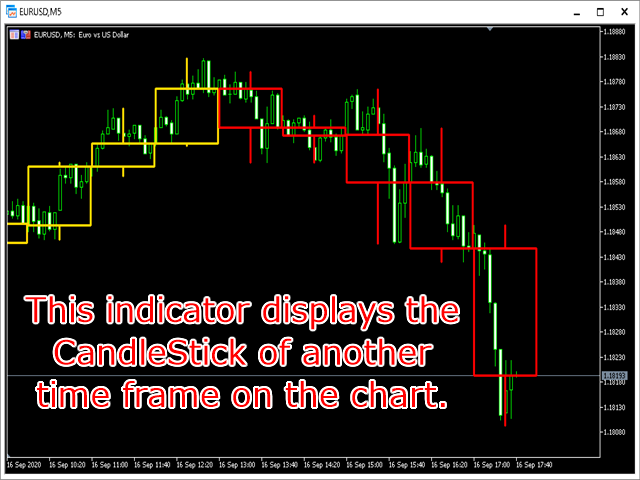
Dieser Indikator zeigt den CandleStick eines anderen Zeitrahmens auf dem Chart an.
Indem Sie die Informationen in mehreren Zeitdiagrammen gleichzeitig verstehen, können Sie die Gesamtansicht des Marktes besser nachvollziehen.
Er ist auch ein nützliches Instrument zur Validierung und Untersuchung vergangener Kurse und Geschäfte.
Es gibt ähnliche Produkte von anderen Anbietern, aber ich habe es so konzipiert und entwickelt, dass es für mich einfach zu bedienen ist.
Eigenschaften von CandleStick only
Wenn ich handele, ist das Wichtigste die Bedienbarkeit.
Es gibt Händler, die arbeiten, indem sie mehrere Charts verschiedener Zeitrahmen auf dem Display öffnen.
Aber ich tue das nicht.
Das ist schwer zu sehen und schwer zu verstehen.
Ich öffne einen Chart für ein Währungspaar.
Während ich den Zeitrahmen des Charts wechsle, nutze ich die MTF-Analyse, um die Informationen zu erhalten, die ich brauche.
Bisher gab es ähnliche Indikatoren, aber es gab das Problem, dass nur ein Zeitrahmen eingestellt werden konnte.
Wenn ich zum Beispiel H1-CandleStick zum Zeichnen einstelle, kann ich auf dem 15-Minuten-Chart zeichnen, aber nicht auf dem Tages-Chart.
Mit diesem Indikator können Sie daher den CandleStick-Zeitrahmen für jeden MT4/MT5-Chart festlegen.
Mit anderen Worten: Der angegebene CandleStick kann beim Wechsel zu einem beliebigen Chart angezeigt werden.
Dieser Weg ist einfach zu sehen und zu verstehen.
Außerdem wird die Arbeit mit MT4/MT5 auf diese Weise leichter und bequemer.
Ich habe den CandleStick entwickelt, um auf diese Weise die beste Leistung zu erzielen.
Was kann in der Eigenschaft eingestellt werden
- Sie können den CandleStick-Zeitrahmen für jeden MT4/MT5-Chart einstellen.
- Unterstützt 8 Arten von CandleStick: M5, M15, M30, H1, H4, D1, W1, MN1.
- Sie können den CandleStick durch Drücken einer Taste auf der Tastatur ein-/ausblenden (die Standardtaste ist "C").
- CandleStick kann die Linienfarbe, die Linienbreite und die Linienart festlegen. (Der Linientyp kann jedoch nur eingestellt werden, wenn die Linienbreite 1 beträgt).
- Es kann eingestellt werden, ob der CandleStick beim Laden des Indikators angezeigt werden soll oder nicht.
- Der empfohlene Wert für den "Berechnungsbereich" ist 2000-10000. Je höher dieser Wert ist, desto mehr CandleSticks werden gezeichnet, aber auch langsamer, je nach den Spezifikationen Ihres Computers.
Meine Einstellungen
Wie ich schon sagte, öffne ich nur einen Chart für ein Währungspaar und verwende ihn, indem ich den Zeitrahmen wechsle.
Ich möchte nicht, dass der Candle Stick angezeigt wird, wenn ich zwischen den Zeitrahmen wechsle.
Ich möchte ihn nicht immer sehen.
Ich möchte ihn nur sehen, wenn ich ihn brauche.
Setzen Sie daher "Beim Laden anzeigen" auf false. (Standard ist true)
Verwenden Sie die Show/Hide-Taste, um den CandleStick anzuzeigen.
Sie können die Tasten a-z den Tasten "Anzeigen/Ausblenden" zuweisen. (Standardeinstellung ist C)
Im Fall des H1-Diagramms möchte ich den CandleStick von D1 anzeigen, also stelle ich ihn in der Eigenschaft so ein.
Stellen Sie die anderen Zeitrahmen auf die gleiche Weise ein.
Stellen Sie auch CandleStick Color, Line Width und Line Style ein.
In meinem Fall...
Bullish CandleStick Farbe=Gold.
Bearish CandleStick Farbe=Rot.
Linienbreite=1.
Linienstil=Einfarbig.
Der Berechnungsbereich ist standardmäßig 5000.
Mit dieser Einstellung habe ich keine Probleme.
Ändern Sie sie bei Bedarf.