MAtsi
- Indicadores
- Versión: 2.8
- Actualizado: 30 mayo 2020
- Activaciones: 10

Indicador de tendencia profesional 0 Lag MAs
MAtsi es un indicador de sensor de tendencia, donde 2 MA-s operan simultáneamente.
Está diseñado para cubrir un rango más amplio de tendencias dinámicas, donde MAi no es tan efectivo.
Los promedios incluidos se describen en la sección de código del indicador MAi .
El indicador MAtsi puede ejecutar muchas instancias, para todos los marcos de tiempo a la vez, por lo que puede probar y comparar los resultados con diferentes configuraciones.
Es muy rápido y tiene, como todos nuestros indicadores, una tecnología incorporadade "prueba de historial de deslizamiento".
El programa está diseñado para operar en 2 modos automáticos:
1. Modo deslizante
Se activa al conectar el indicador al Chart o Visual Tester.2. Modo experto
Aquí puede probar/ajustar sus parámetros en el historial con el "deslizador" hasta 32767 barras.
Por lo tanto, mientras que Visual Testing EA, puede adjuntar el indicador y ajustar fácilmente los parámetros de entrada para los puntos críticos.
En Tester (sólo) puede salir del "modo deslizante" pulsando la tecla <Esc>.
Usted puede cambiar fácilmente entre los marcos de tiempo en la posición seleccionada y comparar los resultados.
Por favor, vea "conmutación" en HD . .. https://youtu.be/tAoB4FPTrRU
Se activa cuando se inicia el indicador a través de experto con la función "iCustom".
Está diseñado sólo para el uso de EA y la "prueba del historial de deslizamiento" está desactivada.
Indicador está equipado con "Control de errores", de modo que siempre se puede ver lo que va mal y corregir esto.
Está probado y funciona muy bien en nuestro EA "PointerX".
Por favor, ver "pruebas" en HD . .. https://youtu.be/2qh3qTaGVAE
¿Cómo operar con MAtsi?
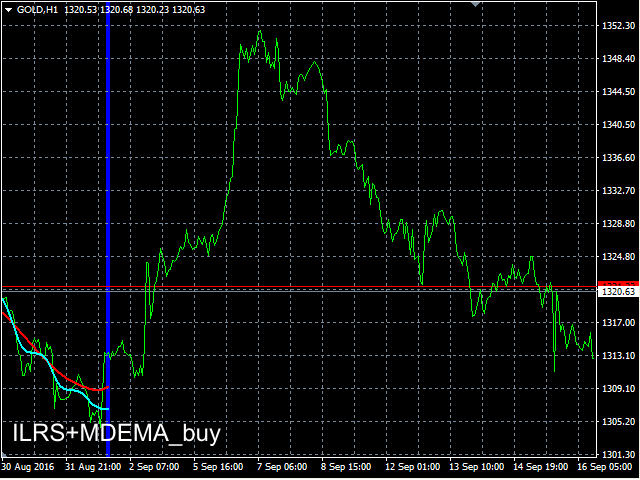
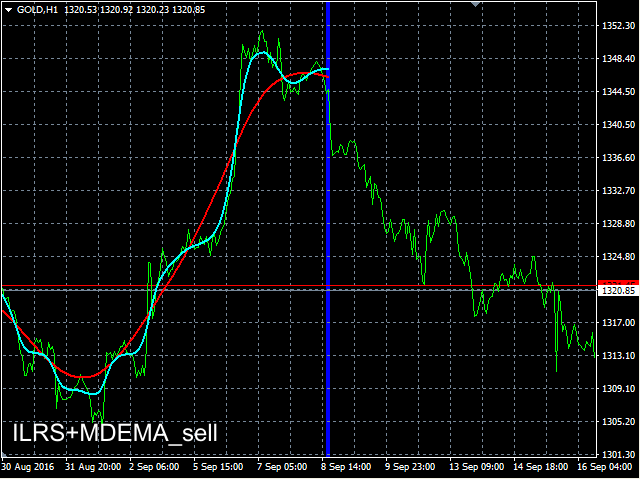
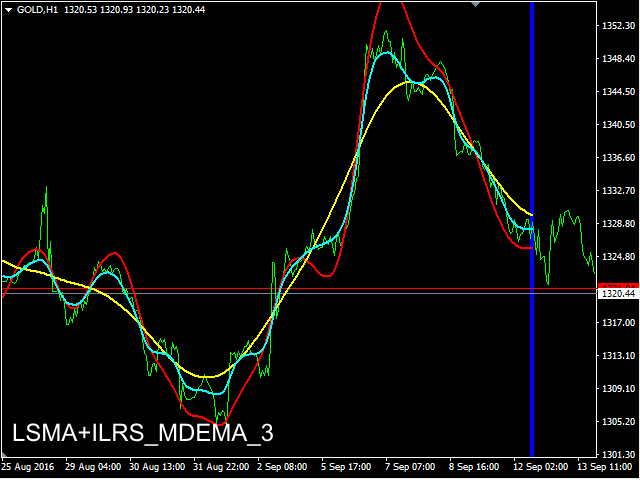
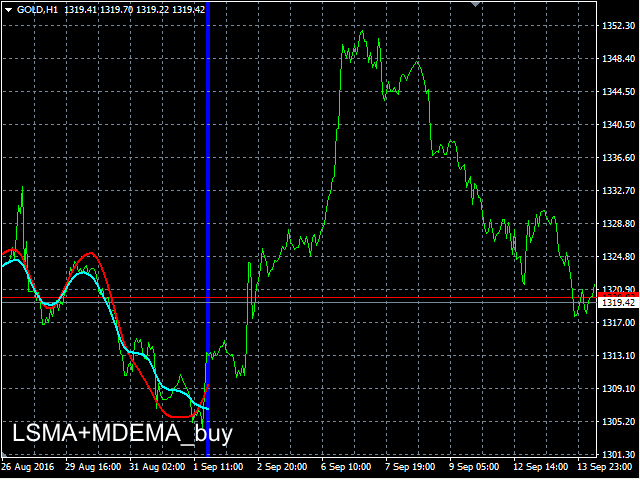
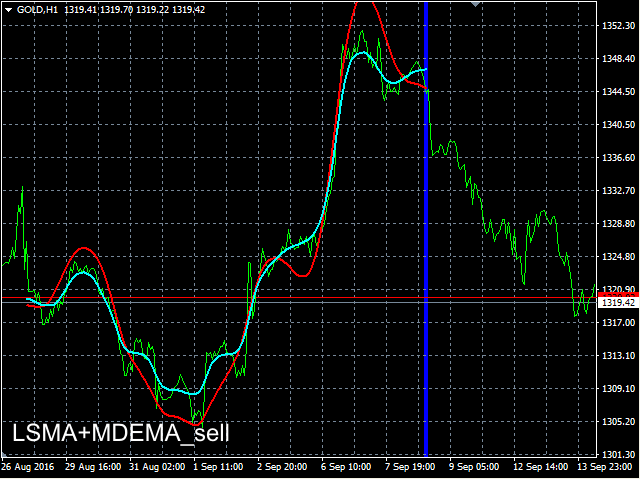
Cuando la LÍNEA_1 sube y está por encima de la LÍNEA_2 usted COMPRA, cuando la LÍNEA_1 baja y está por debajo de la LÍNEA_2 usted VENDE.Usted también tiene algunas otras opciones (uso en combinación con nuestros indicadores, el uso en algunos otros indicadores ...).
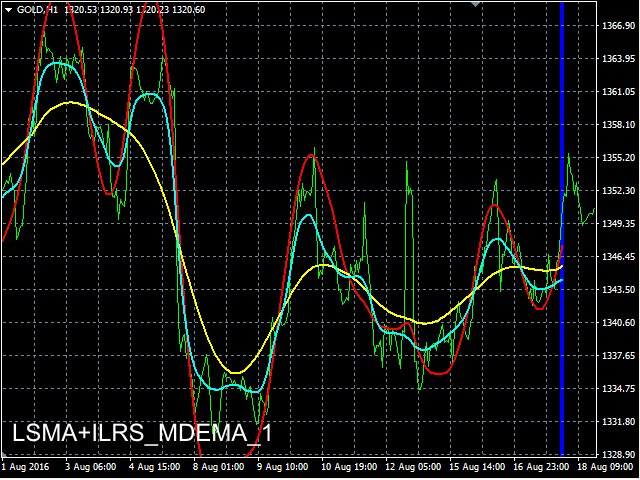
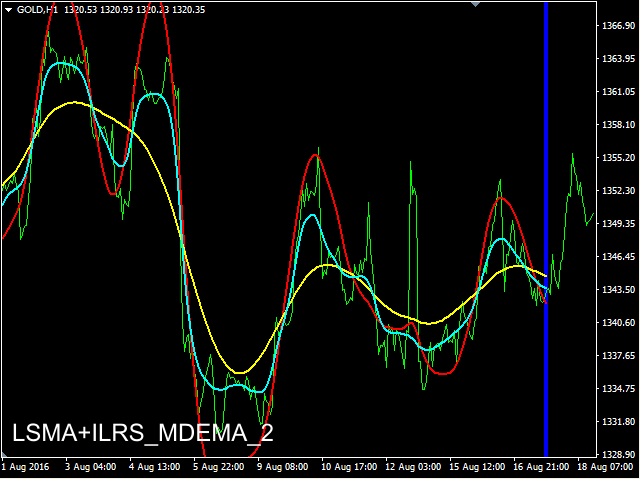
Recomendamos ejecutar más instancias del indicador en diferentes marcos de tiempo, con diferentes configuraciones para obtener mejores resultados (M15, H1, H4).
Para los programadores
Usted puede incluir en EA-s "método enum" código. (por favor vea la sección de código MAiindicator)Los comandos conocidos para recuperar el valor actual y el anterior son para MQL4:
double L1Cur=iCustom(NULL,MAtsi_TF_,"MAtsi",L1_MTD_,L1_st_,L1_sm_,L1_vf_,L1_lam_,L2_MTD_,L2_st_,L2_sm_,L2_vf_,L2_lam_,1,0,1);
double L1Prev=iCustom(NULL,MAtsi_TF_,"MAtsi",L1_MTD_,L1_st_,L1_sm_,L1_vf_,L1_lam_,L2_MTD_,L2_st_,L2_sm_,L2_vf_,L2_lam_,1,0,2);
double L2Cur=iCustom(NULL,MAtsi_TF_,"MAtsi",L1_MTD_,L1_st_,L1_sm_,L1_vf_,L1_lam_,L2_MTD_,L2_st_,L2_sm_,L2_vf_,L2_lam_,1,1,1);
if(L1Cur>L1Prev&&L1Cur>L2Cur) buyMAtsi_=true;
if(L1Cur<L1Prev&&L1Cur<L2Cur) sellMAtsi_=true;
donde:
NULL = símbolo actual
MAtsi_TF_ = enum_timeframes
"MAtsi" = ruta/nombre del programa compilado del indicador personalizado
L1(2)_MTD_ = línea_1(2) método (de 0-16)
L1(2)_st_ = línea_1(2) paso
L1(2)_sm_ = línea_1(2) suavidad (suavidad de las líneas)
L1(2)_vf_ = line_1(2) v_factor (factor de volumen)
L1(2)_lam_ = línea_1(2) lambda
1 = última barra (1 para resultados precisos, porque la barra 0 no suele completarse)
0(1) = índice de línea
1(2) = desplazamiento
Ajustes de los parámetros de entrada MAtsi
El orden de izquierda a derecha es: nombre, [valor por defecto], valor mín-máx.Si introduce accidentalmente un valor inferior o superior, se utiliza el valor mín-máx.
- L1_method [LSMA] - método línea_1
- L1_step [35] 0-100 - paso línea_1
- *L1_smooth [0] 0-100 - suavidad de línea_1
- *L1_v_factor [1.0] 0.0-50.0 - factor de volumen de línea_1
- *L1_lambda [0.3] 0.0-100.0 - lambda de línea_1 (habilitado sólo para REMA, REMA_Hull)
- L2_method [MDEMA] - método línea_2
- L2_step [8] 0-100 - paso línea_2
- *L2_smooth [0] 0-100 - suavidad de línea_2
- *L2_v_factor [1.0] 0.0-50.0 - factor de volumen de línea_2
- *L2_lambda [0.3] 0.0-100.0 - lambda de la línea 2 (habilitado sólo para REMA, REMA_Hull)
- LastBar [0] 0-6000 - dibujar la última barra (orden descendente izquierda-derecha, 0 es la última)
- PastBars [100] 1-6000 - dibujo de barras hacia el pasado (hacia la izquierda)
*para ciertos métodos está desactivado, dependiendo de la naturaleza de la MA-s
Información adicional
La versión demo está construida para demostrar las principales características y usabilidad de MAtsi, MAtsiDemo.
Si desea utilizar MAtsi ilimitadamente o dentro de un EA tiene que comprar o alquilar este producto.
¿Estás satisfecho con nuestro trabajo? Comparte tus experiencias y deja un comentario.
Si necesitas ayuda para utilizar nuestras herramientas de trading o tienes algún problema o pregunta, por favor contacta conmigo.
VLabs