Fibo Linear Channel
- Indikatoren
- Version: 1.21
- Aktualisiert: 26 März 2020
- Aktivierungen: 5

Farbiger Indikator des linearen Kanals auf der Grundlage der Fibonacci-Folge. Er wird verwendet, um Handelsentscheidungen zu treffen und die Marktstimmung zu analysieren. Die Kanalgrenzen stellen starke Unterstützungs-/Widerstandsniveaus dar, da sie die Fibonacci-Proportionsniveaus sind.
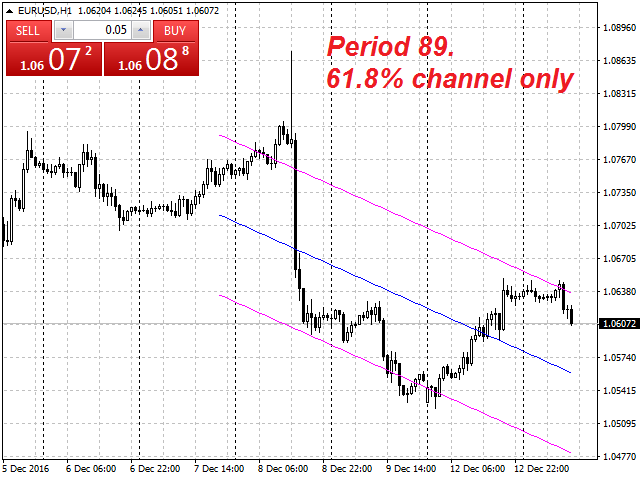
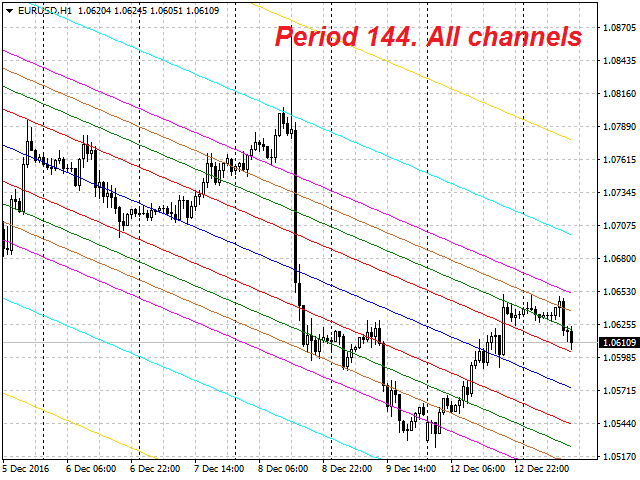
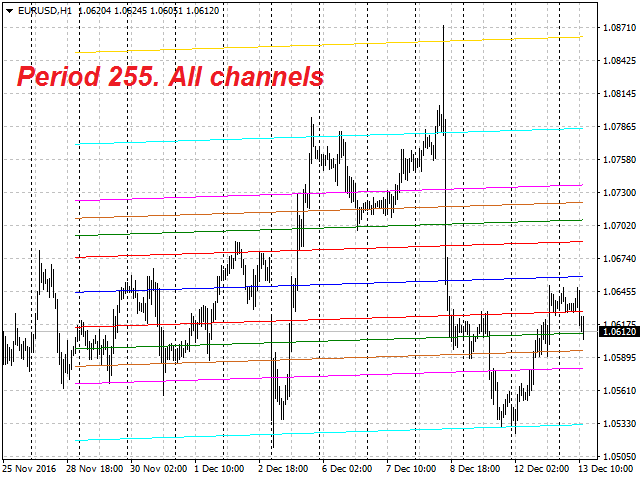
Der Benutzer kann die Anzahl der angezeigten Linien der Kanalbegrenzungen auf dem Diagramm mit Hilfe der Eingabeparameter auswählen.
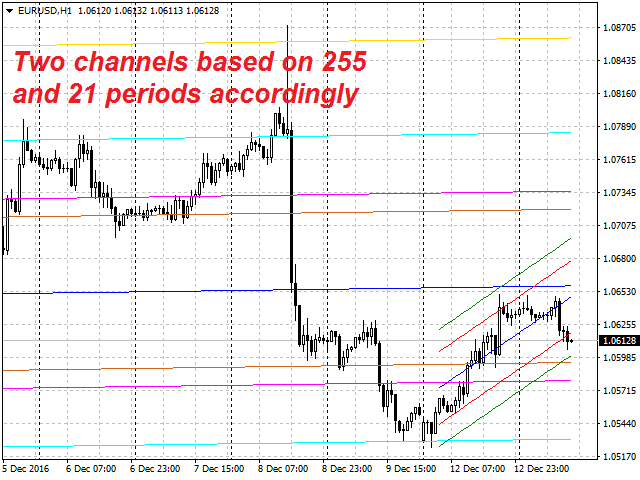
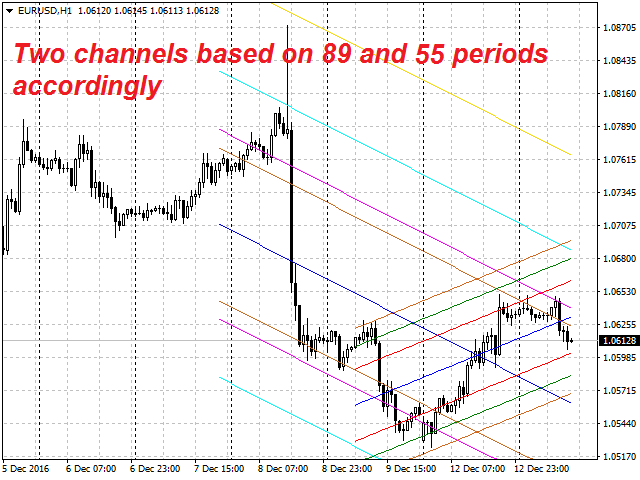
Wenn Sie mehrere Instanzen des Indikators mit unterschiedlichen Berechnungszeiträumen in den Chart einfügen, können Sie ein System von Kanälen auf dem Chart anzeigen lassen.
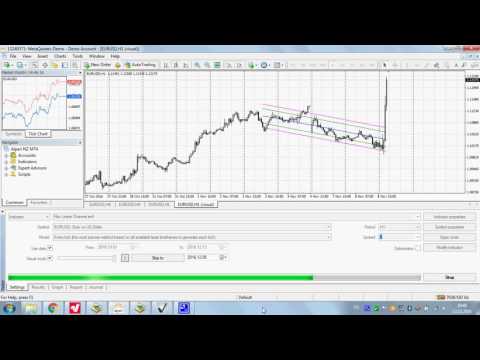
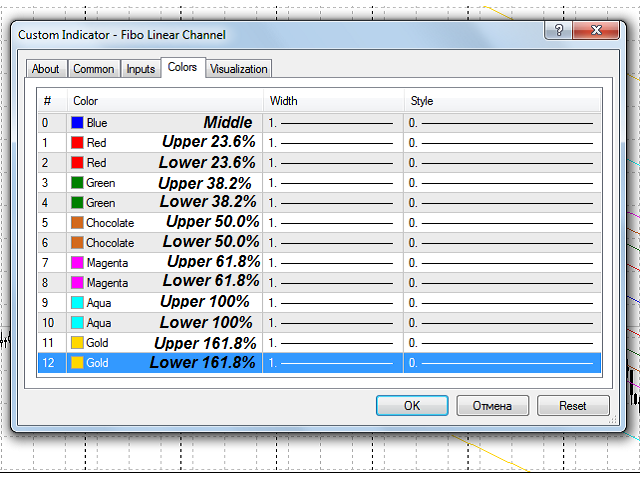
Die Funktionsweise und die verschiedenen Anwendungsmöglichkeiten des Indikators werden in den Screenshots und im beigefügten Video gezeigt. Die Mitte des Kanals wird in blau dargestellt. Die Kanalgrenzen werden in individueller Farbe paarweise für jede entsprechende Fibonacci-Erweiterung dargestellt.
Ein hervorragendes Zusammenspiel wird in Verbindung mit dem Indikator Linear Regression Global erreicht.
Zweck
Der Indikator kann für den manuellen oder automatisierten Handel innerhalb eines Expert Advisors verwendet werden. Die Werte des Indikatorpuffers vom Typ Double können für den automatisierten Handel verwendet werden:
- Kanalmittellinie - Puffer 0.
- Obere 23,6% Begrenzungslinie - Puffer 1.
- Untere 23,6% Begrenzungslinie - Puffer 2.
- Obere 38,2% Begrenzungslinie - Puffer 3.
- Untere 38,2% Begrenzungslinie - Puffer 4.
- Obere 50,0%-Grenze - Puffer 5.
- Untere 50,0%-Grenze - Puffer 6.
- Obere 61,8%-Grenzlinie - Puffer 7.
- Untere 61,8 %-Grenzlinie - Puffer 8.
- Obere 100,0%-Grenzlinie - Puffer 9.
- Untere 100,0%-Grenzlinie - Puffer 10.
- Obere 161,8%-Grenzlinie - Puffer 11.
- Untere 161,8 %-Grenzlinie - Puffer 12.
Die Werte der Puffer dürfen nicht gleich Null sein.
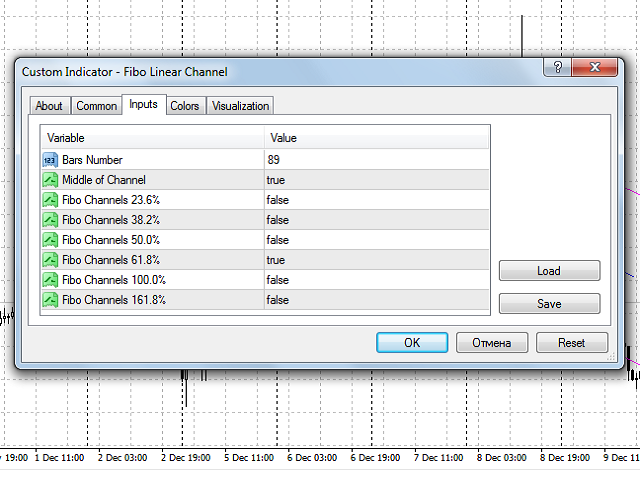
Eingabeparameter
- Bars_Number - Anzahl der Bars für die Berechnung des Indikators.
- Mitte des Kanals - Zeigt die Mitte des Kanals auf dem Chart an:
- true - ja.
- false - nein.
- Fibo-Kanäle 23,6% ....... Fibo Channels 161.8% - Anzeige der 23.6% ........ 161,8%-Kanalgrenzen auf dem Diagramm an:
- true - ja.
- falsch - nein.


The indicator was a good tool to identify trends and also the key resistance levels