Opposite Prices CD HTB
- Indikatoren
- Version: 1.32
- Aktualisiert: 24 Juli 2024
- Aktivierungen: 7

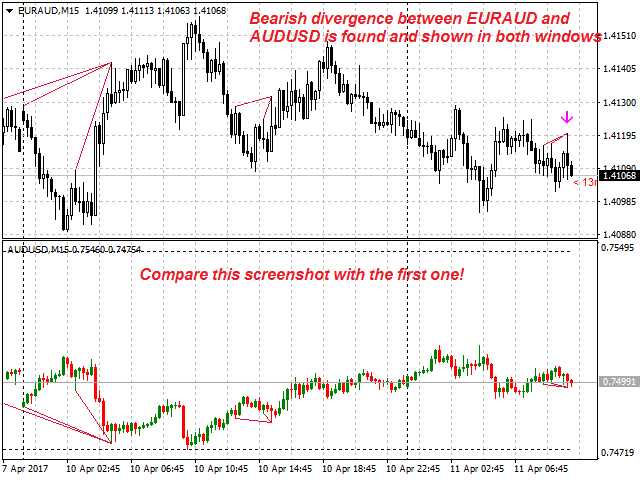
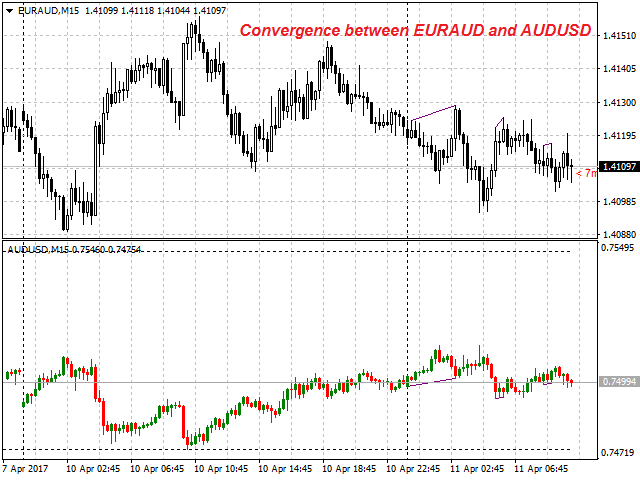
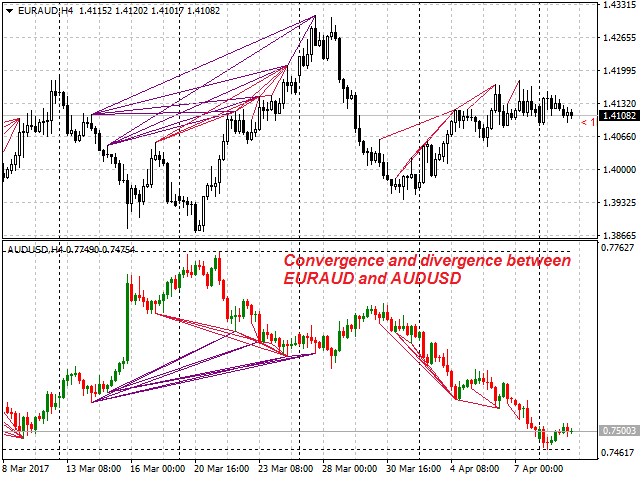
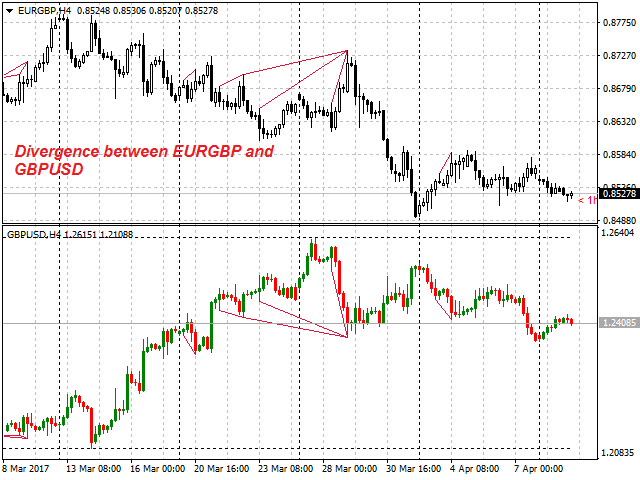
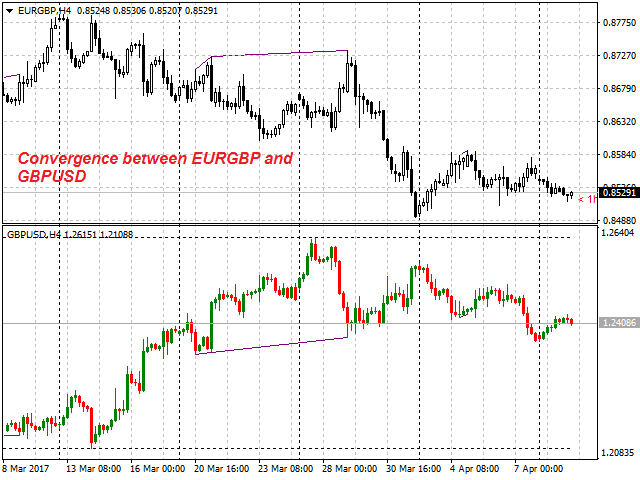
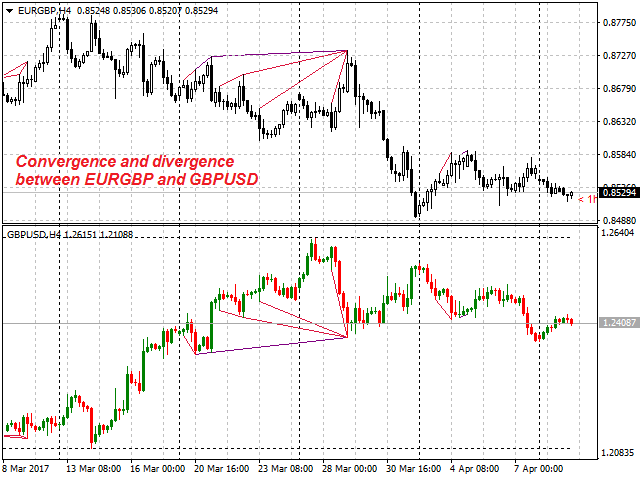
OP CD HTB (Opposite Prices Convergence/Divergence High Top Bottom) ist ein Indikator für die Konvergenz/Divergenz der bärischen Stimmung unter den gespiegelten Finanzinstrumenten. Der Indikator ist die zweite von zwei möglichen Versionen (HBT und HTB) der bärischen Konvergenz/Divergenzursprünge.
Die Mehrfachverwendung des Indikators ermöglicht es Ihnen, Konvergenzen/Divergenzen zwischen dem Preis des Hauptfinanzinstruments und beliebigen anderen Finanzinstrumenten gleichzeitig zu finden.
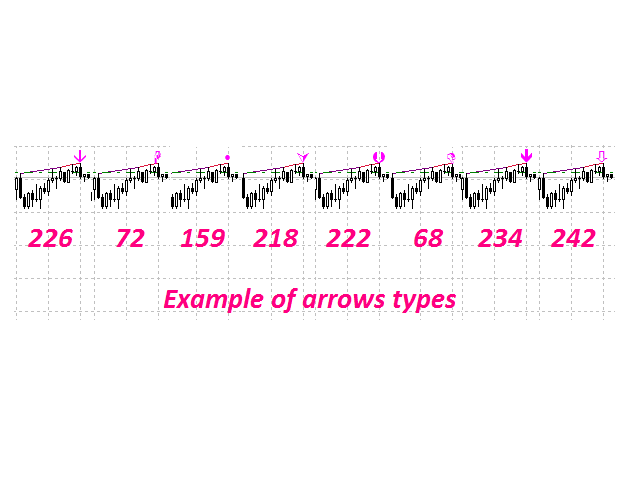
Der Benutzer kann das grafische Verkaufssymbol und dessen Breite sowie die Farbe der Konvergenz-/Divergenzlinien auswählen.
Der Indikator ist kein nachlaufender Indikator. Er arbeitet mit Ticks und ist in der Lage, Konvergenz/Divergenz im Fenster des Symbols anzuzeigen, auch wenn kein separates Fenster mit einem anderen Finanzinstrument für die Suche verwendet wird. Dies ermöglicht es Ihnen, zusätzliche Fenster mit anderen Indikatoren für eine gemeinsame Analyse zu öffnen.
Optional kann der Indikator ein neues Signal mit dem grafischen Verkaufssymbol anstelle der Konvergenz-/Divergenzlinien anzeigen.
In den meisten Fällen gilt eine Konvergenz/Divergenz als bestätigt, wenn sie die Form einer Linie mit einem grafischen Symbol auf dem Chart annimmt.
Die Suche nach einer Konvergenz/Divergenz bei einem Finanzinstrument bedeutet, die Unterstützungs-/Widerstandsniveaus zu finden!
Achtung! Da der Indikator heruntergeladen wird, werden die grafischen Symbole im Hauptfenster nur angezeigt, wenn ein neues Konvergenz-/Divergenzsignal erscheint (im Gegensatz zu Konvergenz-/Divergenzlinien). Für die vergangenen Perioden (bevor der Indikator heruntergeladen wurde) werden keine grafischen Symbole angezeigt.
Um die Konvergenz-/Divergenzlinien im Zusatzfenster darzustellen, identifiziert der Indikator einen der elf benutzerdefinierten Indikatoren (siehe Eingabeparameter), falls vorhanden.
Der Indikator kann das Auftreten eines gebildeten Signals durch ein Tonsignal oder durch das Senden einer E-Mail melden.
Beispiel einer E-Mail-Benachrichtigung:
- Betreff: Gegensätzliche Preise CD HTB Signal;
- Nachricht: Signal,M1 - Bearish Divergence zwischen EURAUD und AUDUSD - 2016.09.07 11:15:00.
Zweck
Der Indikator kann für den manuellen oder automatisierten Handel innerhalb eines Expert Advisors verwendet werden. Für den automatisierten Handel verwenden Sie den Indikatorpuffer vom Typ Double:
- Verkaufssignal - Puffer 0, darf nicht Null sein.
Eingabeparameter
- Currency_Name - Name des Finanzinstruments;
- Bars_Number - Anzahl der Bars für die Berechnung;
- Base_Indicator - Code des Basisindikators(dieser Parameter wird nur aktiviert, wenn ein benutzerdefinierter Indikator vorhanden ist):
- Arrow_Symbol - grafischer Verkaufssymboltyp (erkennt eines der acht Symbole, siehe Screenshot);
- Arrow_Width - Breite des grafischen Symbols (zulässige Werte - 1, 2, 3, 4, 5);
- Sound_Mail_Numbers - Anzahl der Audio- und E-Mail-Benachrichtigungen auf den letzten beiden Balken;
- DrawLine - Anzeige der Konvergenz-/Divergenzlinie.
- true - zeichnet die Linien (Voreinstellung);
- false - die Linien werden nicht gezeichnet.
- Konvergenz - Berechnung der Konvergenz oder Divergenz:
- true - Konvergenz (Voreinstellung);
- false - Divergenz.
- Ideal_Searching - Suche nach Konvergenz/Divergenz unter nicht-idealen Bedingungen:
- true - ideale Suchbedingungen (Voreinstellung);
- false - nicht-ideale Suchbedingungen.
- Play_Sound - aktiviert Sound-Benachrichtigungen;
- Show_Time - Anzeige der verbleibenden Zeit bis zur Bildung des aktuellen Balkens;
- Send_Mail - sendet eine E-Mail-Benachrichtigung;
- ConvLevelColor_1 - Farbe der Konvergenzlinie im Hauptfenster;
- ConvLevelColor_2 - Farbe der Konvergenzlinie im Zusatzfenster;
- DivLevelColor_1 - Farbe der Divergenzlinie im Hauptfenster;
- DivLevelColor_2 - Farbe der Divergenzlinie im Zusatzfenster; DivLevelColor_2 - Farbe der Divergenzlinie im Zusatzfenster.
Empfehlungen
Vor dem Einsatz des Indikators ist die Aktualisierung der historischen Daten der Finanzinstrumente erforderlich!