MACD Histo Smart
- Indikatoren
- Version: 1.22
- Aktualisiert: 18 Juli 2024
- Aktivierungen: 7

Beschreibung
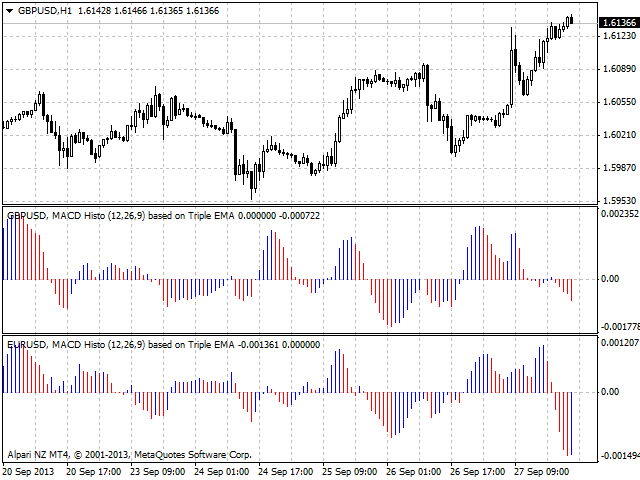
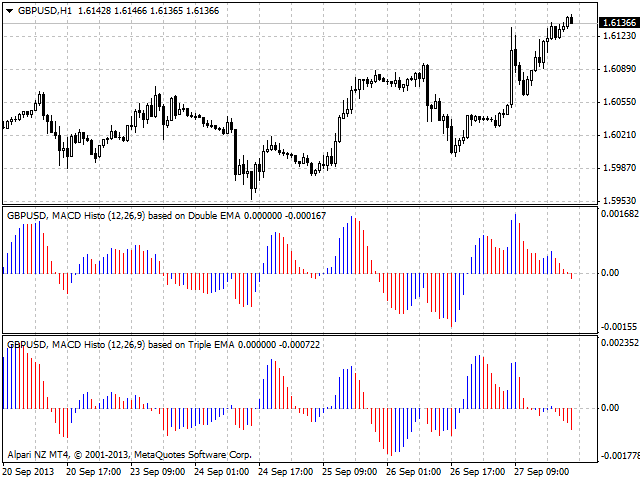
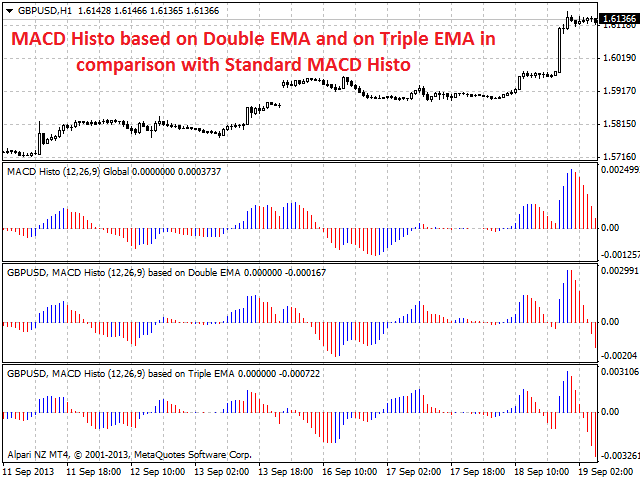
Ein farbiger universeller Multiwährungs-/Multisymbol-Indikator MACD Histo Smart (MACD-Histogramm), der auf dem doppelten oder dreifachen gleitenden Durchschnitt basiert.
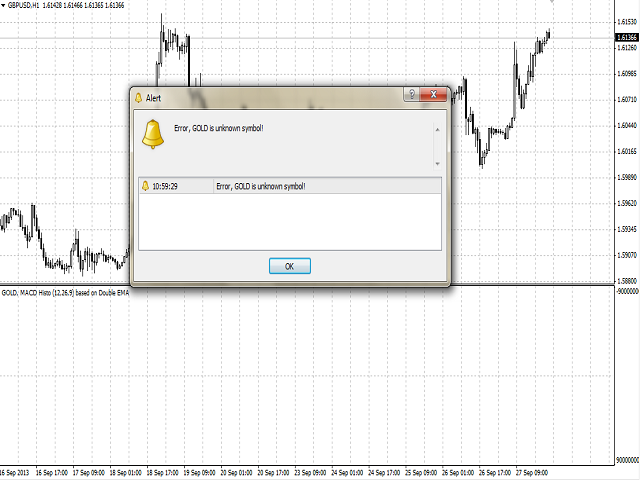
Der Indikator kann mit jedem Broker verwendet werden, unabhängig von der Bezeichnung des Finanzinstruments, da es notwendig ist, die Bezeichnung manuell als Eingabeparameter einzugeben. Wenn Sie einen nicht existierenden oder falschen Namen eines Finanzinstruments eingeben, erhalten Sie eine Fehlermeldung, dass dieses Finanzinstrument unbekannt ist (nicht existiert).
Sie können die Farbgebung für die steigenden und fallenden Linien des Indikatorhistogramms auswählen.
Zweck
Der Indikator kann für den manuellen oder automatischen Handel innerhalb eines Expert Advisors verwendet werden. Für den automatisierten Handel verwenden Sie einen beliebigen Indikatorpuffer des Double:
- Hauptlinie des Indikators - Puffer 4.
- Steigende Linie des Histogramms - Puffer 0, darf nicht gleich Null sein.
- Fallende Linie des Histogramms - Puffer 1, darf nicht gleich Null sein.
Eingabe-Parameter
- Currency_Name - Name des Finanzinstruments.
- Calc_Method - Methode der Berechnung des Indikators:
- auf der Grundlage des doppelten gleitenden Durchschnitts (Standard).
- auf der Grundlage des dreifachen gleitenden Durchschnitts.
- FastMA - Periode des schnellen gleitenden Durchschnitts.
- SlowMA - Periode des langsamen gleitenden Durchschnitts.
- SignalMA - Periode der Signallinie des Basis- und/oder berechneten Indikators.
- MA_Methode - Methode der Mittelwertbildung des Basisindikators MA.
- Signal_Methode - Methode der Mittelwertbildung der Signallinie.
- Angewandter_Preis - für den Basisindikator und/oder den berechneten Indikator verwendeter Preis.
- Shift - Verschiebung des Basisindikators relativ zum Preisdiagramm.