Harmonic SWAN
- Indikatoren
-
Sergey Deev
 I'm implementing your ideas in MQL4: https://www.mql5.com/ru/job/new?prefered=work2it
 - Version: 1.3
- Aktualisiert: 14 Juni 2019
- Aktivierungen: 5
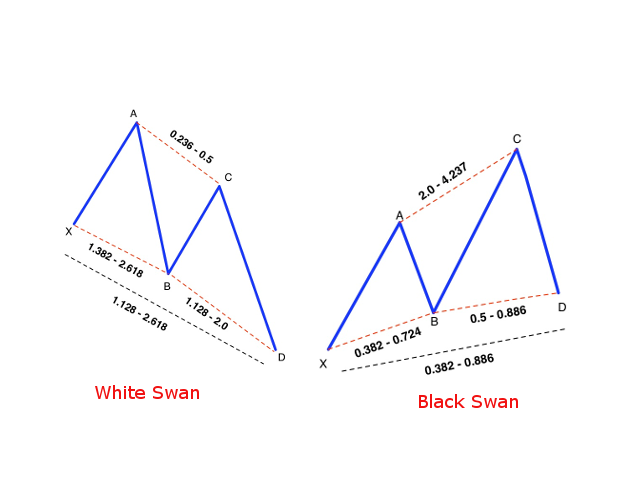
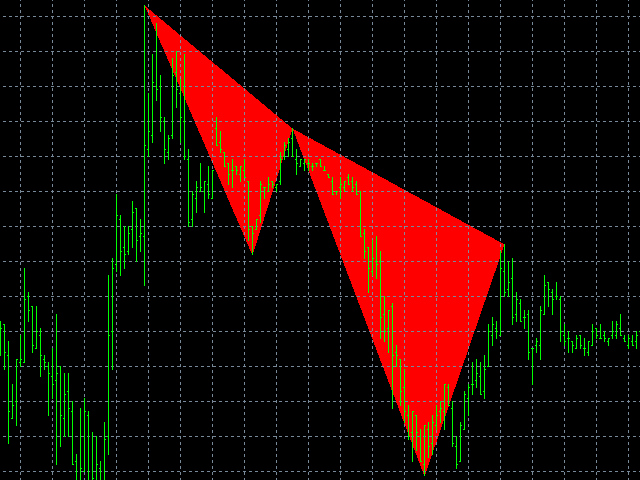
Der Indikator erkennt die harmonischen Muster des Weißen und des Schwarzen Schwans und zeigt sie auf dem Chart nach dem im Screenshot dargestellten Schema an. Das Muster wird durch die Extremwerte des ZigZag-Indikators gezeichnet (in den Ressourcen enthalten, erfordert keine zusätzliche Installation). Nach der Erkennung des Musters benachrichtigt der Indikator über ein Pop-up-Fenster, eine mobile Benachrichtigung und eine E-Mail. Der Indikator hebt nicht nur die vollständige Figur hervor, sondern auch den Zeitpunkt ihrer Bildung. Während der Bildung wird die Figur durch dreieckige Umrisse dargestellt. Sobald die Figur endgültig gebildet ist, wird eine potenzielle Umkehrzone auf dem Chart angezeigt. Die Einstellung wurde um den Parameter patternPreset erweitert, mit dem sich die Proportionen der erkannten Muster festlegen lassen. Die Werte BLACK_SWAN und WHITE_SWAN legen die Standardproportionen der entsprechenden Muster fest, während der Wert MANUAL die Verwendung der benutzerdefinierten Proportionen ermöglicht.
Parameter
- zzDepth, zzDev, zzBack - Zickzack-Parameter
- patternPreset - Typ des zu erkennenden Musters (WHITE_SWAN, BLACK_SWAN, MANUAL)
- XB_min (ab/ax), XB_max (ab/ax) - minimales und maximales Verhältnis der AB- und AX-Ebenen
- AC_min (bc/ab), AC_max (bc/ab) - minimales und maximales Verhältnis der BC- und AB-Ebenen
- BD_min (cd/bc), BD_max (cd/bc) - Mindest- und Höchstwert des Verhältnisses zwischen den Ebenen CD und BC
- XD_min (xd/xa), XD_max (xd/xa) - minimales und maximales Verhältnis von XD- und XA-Niveau
- bearColor - Farbe des bärischen Musters
- bullColor - Farbe des bullischen Musters
- CountBars - begrenzt die Anzahl der vom Indikator zu verarbeitenden Balken (reduziert die anfängliche Downloadzeit)
- UseAlert - aktiviert Pop-up-Meldungen
- UseNotification - Aktiviert Push-Benachrichtigungen
- UseMail - E-Mail-Benachrichtigungen aktivieren
- Präfix - Textlabel, um die Eindeutigkeit der Indikatorobjekte im Chart zu gewährleisten (wenn mehrere Indikatoren an den Chart angehängt sind, müssen in diesen Parametern unterschiedliche Werte eingegeben werden)
- MessageAdd - der Textstring, der den vom Indikator gesendeten Benachrichtigungen hinzugefügt wird.


Der Benutzer hat keinen Kommentar hinterlassen