TripleRSI MT5
- Indikatoren
-
Sergey Deev
 I'm implementing your ideas in MQL4: https://www.mql5.com/ru/job/new?prefered=work2it
 - Version: 1.1
- Aktualisiert: 3 November 2023
- Aktivierungen: 5
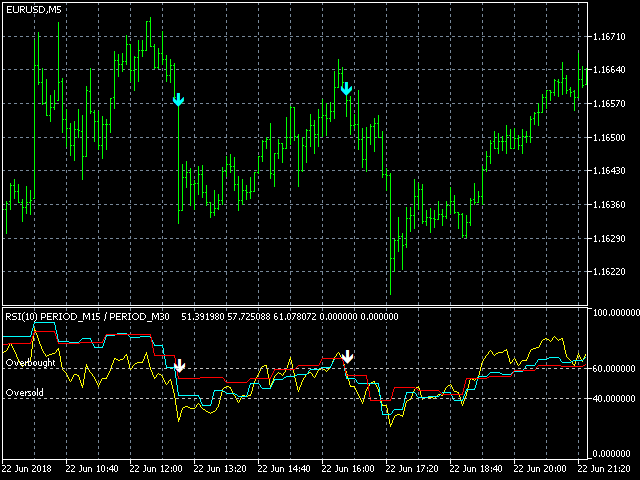
Der Indikator zeigt die RSI-Daten des Arbeits- und der beiden übergeordneten Zeitrahmen auf dem Diagramm an und erzeugt Signale für das Verlassen der überkauften/überverkauften Zone aus der Kurve des durchschnittlichen Zeitrahmens. Optional wird ein Filter verwendet, der auf den Daten des älteren Zeitrahmens basiert (Lage der langsamen Linie über dem Durchschnitt für den Verkauf und unter dem Durchschnitt - für den Kauf).
Die Signale des "Basement"-Indikators werden im Hauptfenster dupliziert, Nachrichten werden an ein Pop-up-Fenster, an E-Mail und an ein mobiles Gerät gesendet.
Parameter des Indikators:
- RSI-Periode, RSI-Preis - RSI-Einstellungen
- Middle TF, Slow TF - mittlerer und älterer Zeitrahmen (Dropdown-Liste)
- checkSlow - Filterberechtigung für den oberen TF
- Overbought Level, Oversold Level - überkaufte und überverkaufte Level.
- Limit Bars - Begrenzung der Anzahl der zu berechnenden Bars beim Setzen des Indikators
- useArrows, useAlert, useEmail=true, useNotification - Auflösung der Pfeile auf dem Hauptbildschirm