Tipu Heikin Ashi Panel
- インディケータ
- バージョン: 2.10
- アップデート済み: 5 2月 2018

Tipu Heikin-Ashi Panel is the modified version of the original Heiken Ashi indicator published by MetaQuotes here.
A professional version of this indicator is available here.
Features
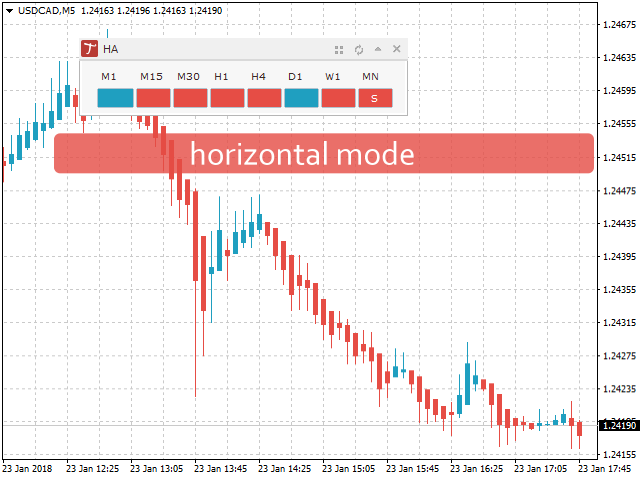
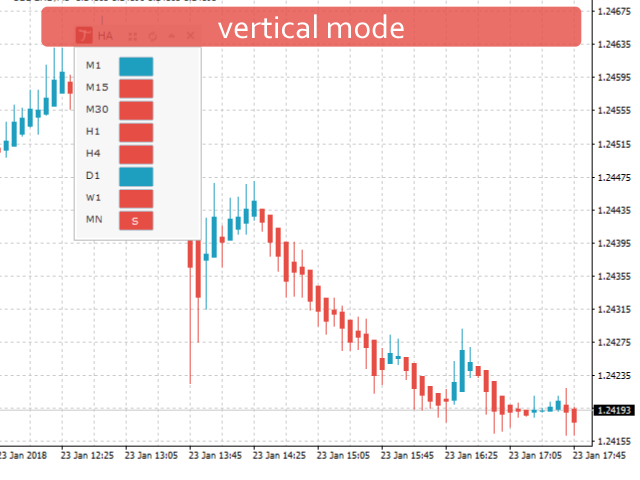
- An easy to use Panel that shows the Heiken Ashi trend of selected timeframe.
- Customizable Buy/Sell alerts, push alerts, email alerts, or visual on-screen alerts.
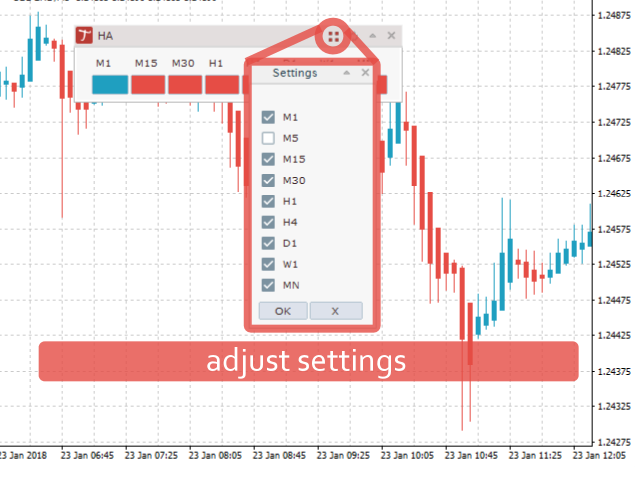
- Customizable Panel. The panel can be moved to any place on the chart or minimized to allow more space.
Heikin means "the average", and Ashi means "foot" in Japanese. Heikin-Ashi is the Japanese charting technique that uses averages of prices for plotting candles. This technique smooths some noise in the candle charts in effort to give a better trend picture. Another example of a common smoothing indicator is moving averages, that can be used in conjunction with Heikin-Ashi.
How to Use
The blue candles mean uptrend, and the red candles mean downtrend. For example, if a pertinent period is upward, the panel will show blue color for that period. It will also display a visual "buy" signal after a change of candle from red to blue. As a best practice, it is recommended to consider signals from other timeframes and/or other indicators before making a trade decision.
Calculation
Close = (Open+High+Low+Close)/
Open = [Open (previous bar) + Close (previous bar)]/2
High = Max (High,Open,Close)
Low = Min (Low,Open, Close)
Parameters
- Show Panel - visibility settings, select true/false to show the panel
- Dialog Mode - Vertical/Horizontal - e.g. horizontal puts time frames horizontal.
- Overlay Indicator - Choose this if you want Heikin Ashi on top of your personal Candlechart, Bar Chart, or Line Chart.
- Uptrend Color - settings for uptrend color on the panel, to change uptrend candle color choose color settings besides input settings
- Buy Signal Color - buy signal color on the panel, this will show buy/sell on change of the candle color
- Downtrend Color - settings for downtrend color on the panel
- Sell Signal Color - sell signal color on the panel
- Alert Shift - candle delay for the signal, enter 1 if you want the alert sent after 1 candle to be passed
- Alert Mobile - select true/false to get push notification on your device, make sure the device settings are correct here
- Alert Onscreen - select true/false to get alert on the terminal, this alert shows in a separate window
- Alert Email - select true/false to get email alerts, make sure email settings are correct here
Developer
int shift = 1; //use this for lookback, 0 means the most current candle, 1 means previous candle

int iSignal = iCustom(_Symbol,_Period,"Market/Tipu Heikin Ashi Panel","",false,0,false,false,false,false,false,false,false,false,false,clrNONE,clrNONE,clrNONE,clrNONE,"",1,false,false,false,4,shift);

int iTrend = iCustom(_Symbol,_Period,"Market/Tipu Heikin Ashi Panel","",false,0,false,false,false,false,false,false,false,false,false,clrNONE,clrNONE,clrNONE,clrNONE,"",1,false,false,false,5,shift); //

if (iSignal == OP_BUY) //represented by "B" and "S" displayed on the panel,
if (iTrend == OP_BUY) //represented by blue colored boxes


Very nice tool