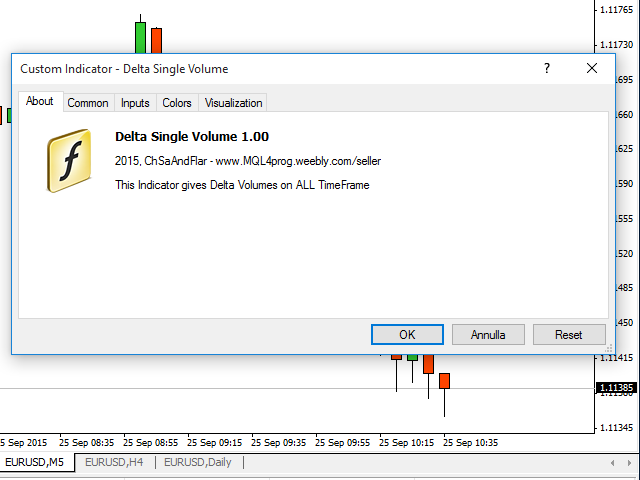
Delta Single Volume
- Indikatoren
-
Chantal Sala
 Hi, I'm a programmer (female) from 1995 and in MQL4 from 2008.
I have released most of 2500 Expert Advisor/Indicators and Dashboard.
I have worked with many famous italian traders to automate their strategy. - Version: 4.13
- Aktualisiert: 20 Dezember 2021
- Aktivierungen: 10
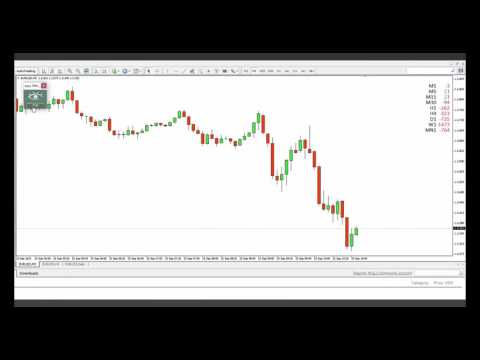
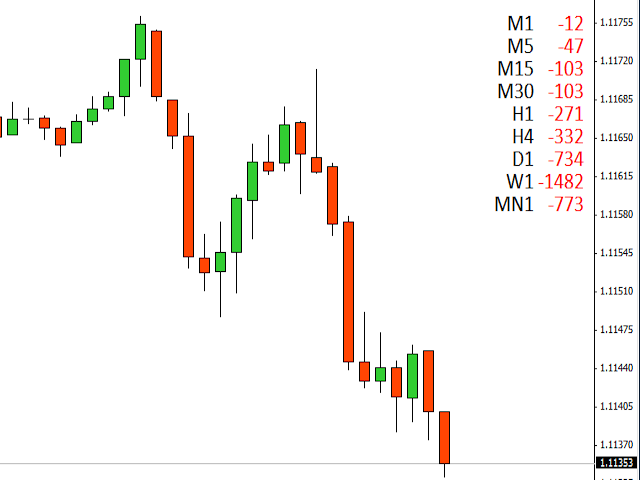
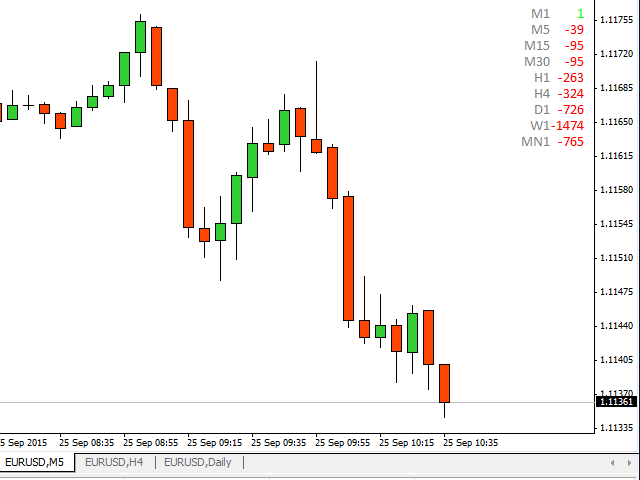
Volume Delta ist ein sehr leistungsfähiger Indikator, der das Angebot auf dem Markt anzeigt.
Er berechnet das Delta aus der Bewegung des Preises und der Differenz der KAUF- und VERKAUFS-Tickvolumina.
Seine besondere Struktur ermöglicht es Ihnen, alle auf der MT4-Plattform verfügbaren Zeitrahmenwerte zu erhalten.
Eine gute Beobachtung dieses Instruments kann großartige Einstiegspunkte und mögliche Umkehrungen vorschlagen.
Wir sind zuversichtlich, dass dieses Tool Ihnen helfen wird, Ihr Trading-Timing zu verbessern.
Siehe auch für MT5: https: //www.mql5.com/en/market/product/51237
Eingaben
- FARBE-GRÖSSE-EINSTELLUNGEN
- Positive Farbe
- NegativeFarbe
- TextFarbe
- NullFarbe
- TextSchriftGröße
- TF SICHTBARKEIT/WARNUNG
- Sichtbar_M1 (wahr/falsch)
- Sichtbar_M5 (wahr/falsch)
- Sichtbar_M15 (wahr/falsch)
- Sichtbar_M30 (wahr/falsch)
- Sichtbar_H1 (wahr/falsch)
- Sichtbar_H4 (wahr/falsch)
- Sichtbar_D1 (wahr/falsch)
- Sichtbar_W1 (wahr/falsch)
- Sichtbar_MN1 (wahr/falsch)
- Warnung bei Diagramm aktivieren (wahr/falsch)
- Benachrichtigung bei Mail aktivieren (wahr/falsch)
- Push einschalten (wahr/falsch)
- PFEIL-EINSTELLUNGEN
-
Pfeil_auf_Signal anzeigen (wahr/falsch)
-
BUY_Arrow_Color
-
SELL_Pfeil_Farbe
-
Pfeil_Größe
- POSITION IM CHART
- X
- Y
- Ecke


I have had this on every chart for several years . It is the one of the first indicators that shows movement as it starts and helps you get in and also helps to show you when to get out. Very good in scalping.