Time Range Separator MT5
- Indikatoren
-
Chantal Sala
 Hi, I'm a programmer (female) from 1995 and in MQL4 from 2008.
I have released most of 2500 Expert Advisor/Indicators and Dashboard.
I have worked with many famous italian traders to automate their strategy. - Version: 2.1
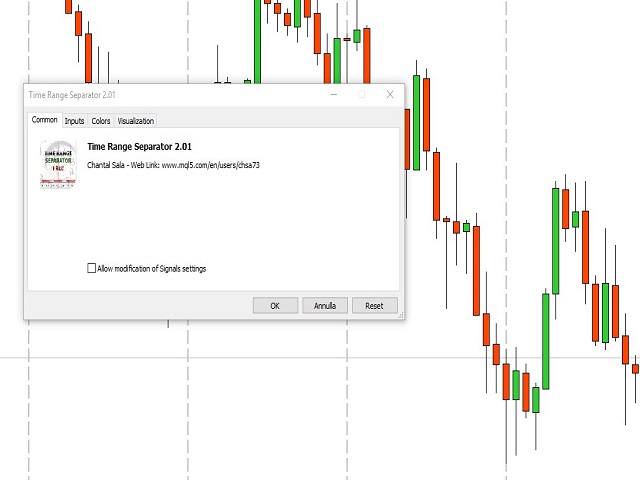
Time Range Separator ist ein nützliches Werkzeug, um einen Trennungszeitraum auf Ihrer Plattform anzuzeigen.
Sie können in den Eigenschaften des Indikators gehen, wählen Sie den gewünschten Bereich und das ist ALLES.
Wir glauben, dass es ein nützliches und notwendiges Tool ist, das wir allen unseren Anhängern kostenlos zur Verfügung stellen möchten.
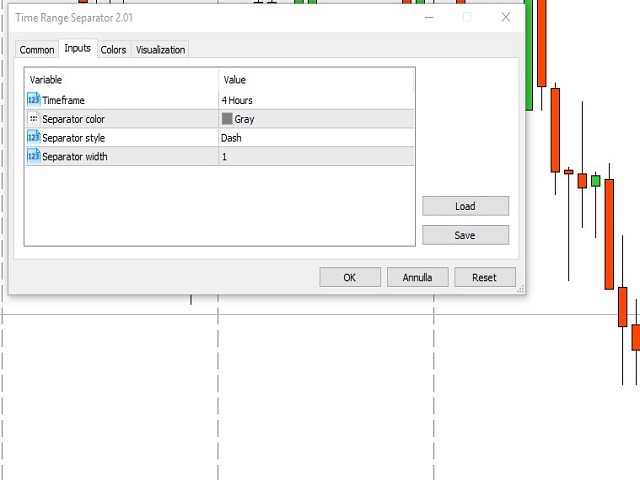
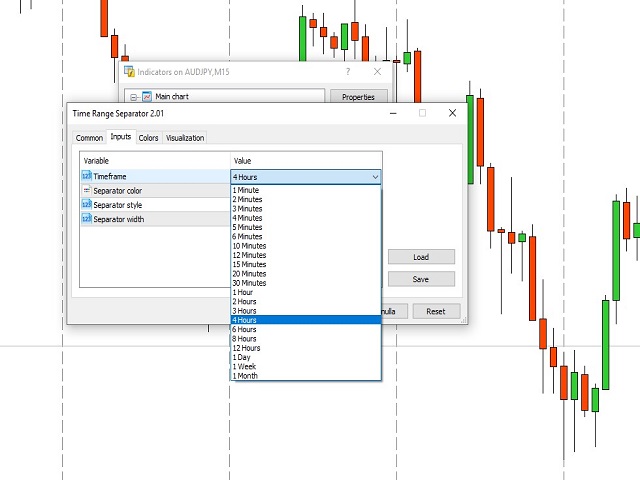
Eingabewerte:
- TimeFrame = Zeitraum-Trennzeichen
- Separator_Color = Vertikale Farblinie
- Separator_Style = Vertikale Farbe Stil
- Separator_Width = Vertikale Linienbreite
Guten Handel an alle und bis bald.
Gleicher Indikator für MT4 hier: https: //www.mql5.com/en/market/product/12780


Helpful. Thank you.