Volume SuperTrend AI
- Indikatoren
-
Minh Truong Pham
 Hello, my name is Pham and I am a programmer and trader! At here, I create amazing forex indicators and expert advisors for Metatrader.
I will try:
+ Provide best tools base on my 5 years experience as a trader and 10 years as a programmer. - Version: 1.5
- Aktualisiert: 29 Mai 2025
- Aktivierungen: 5
"Übersicht
DerVolume SuperTrend AI ist ein fortschrittlicher technischer Indikator zur Vorhersage von Preistrends durch eine Kombination aus traditioneller SuperTrend-Berechnung und KI-Techniken, insbesondere dem k-nearest neighbors (KNN)-Algorithmus.
Der Volume SuperTrend AI wurde entwickelt, um Händlern Einblicke in potenzielle Markttrends zu geben, indem er sowohl volumengewichtete gleitende Durchschnitte (VWMA) als auch den k-nearest neighbors (KNN)-Algorithmus verwendet. Durch die Kombination dieser Ansätze zielt der Indikator darauf ab, präzisere Vorhersagen über Preistrends zu treffen und sowohl bullische als auch bearische Signale zu liefern.
Für die Forex-Branche verwenden wir das Tick-Volumen zur Berechnung.
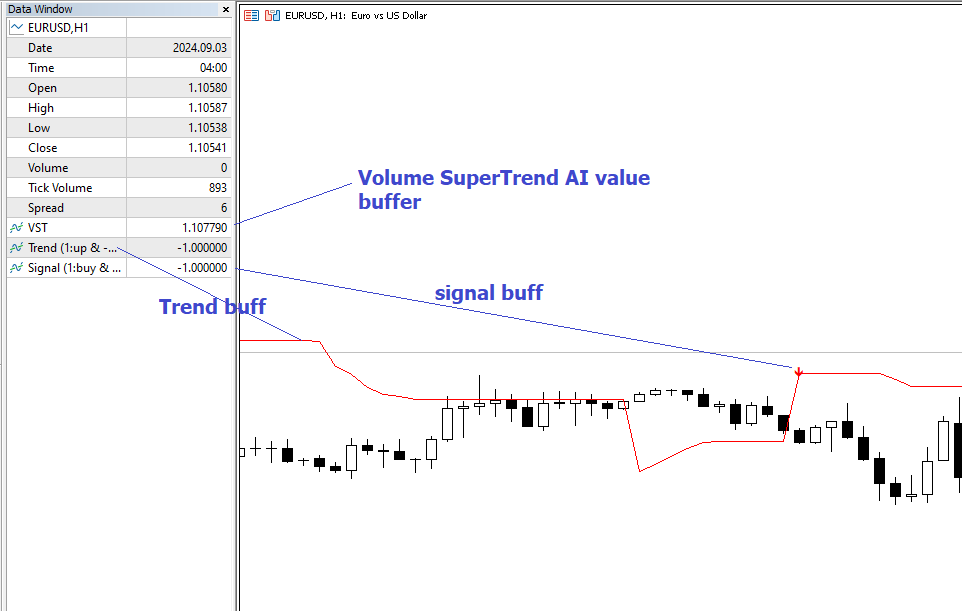
V1.04: Puffer für einfach zu erstellenden EA verfügbar!!! (Bild 5)
Bild 1
"Funktionsweise
Volumenanalyse: Durch die Verwendung von volumengewichteten gleitenden Durchschnitten (VWMA) hebt die Volume SuperTrend AI die Bedeutung des Handelsvolumens in Trendrichtung hervor und kann so genauer auf die Marktdynamik reagieren.
Künstliche Intelligenz Integration - k-Nächste Nachbarn (k-NN) Algorithmus: Der k-NN Algorithmus wird eingesetzt, um auf intelligente Weise historische Datenpunkte zu untersuchen und Abstände zwischen aktuellen Parametern und früheren Daten zu messen. Die nächsten Nachbarn werden zur Erstellung von Prognosemodellen verwendet und passen sich so an komplexe Marktmuster an.
"So verwenden Sie
Trendidentifikation
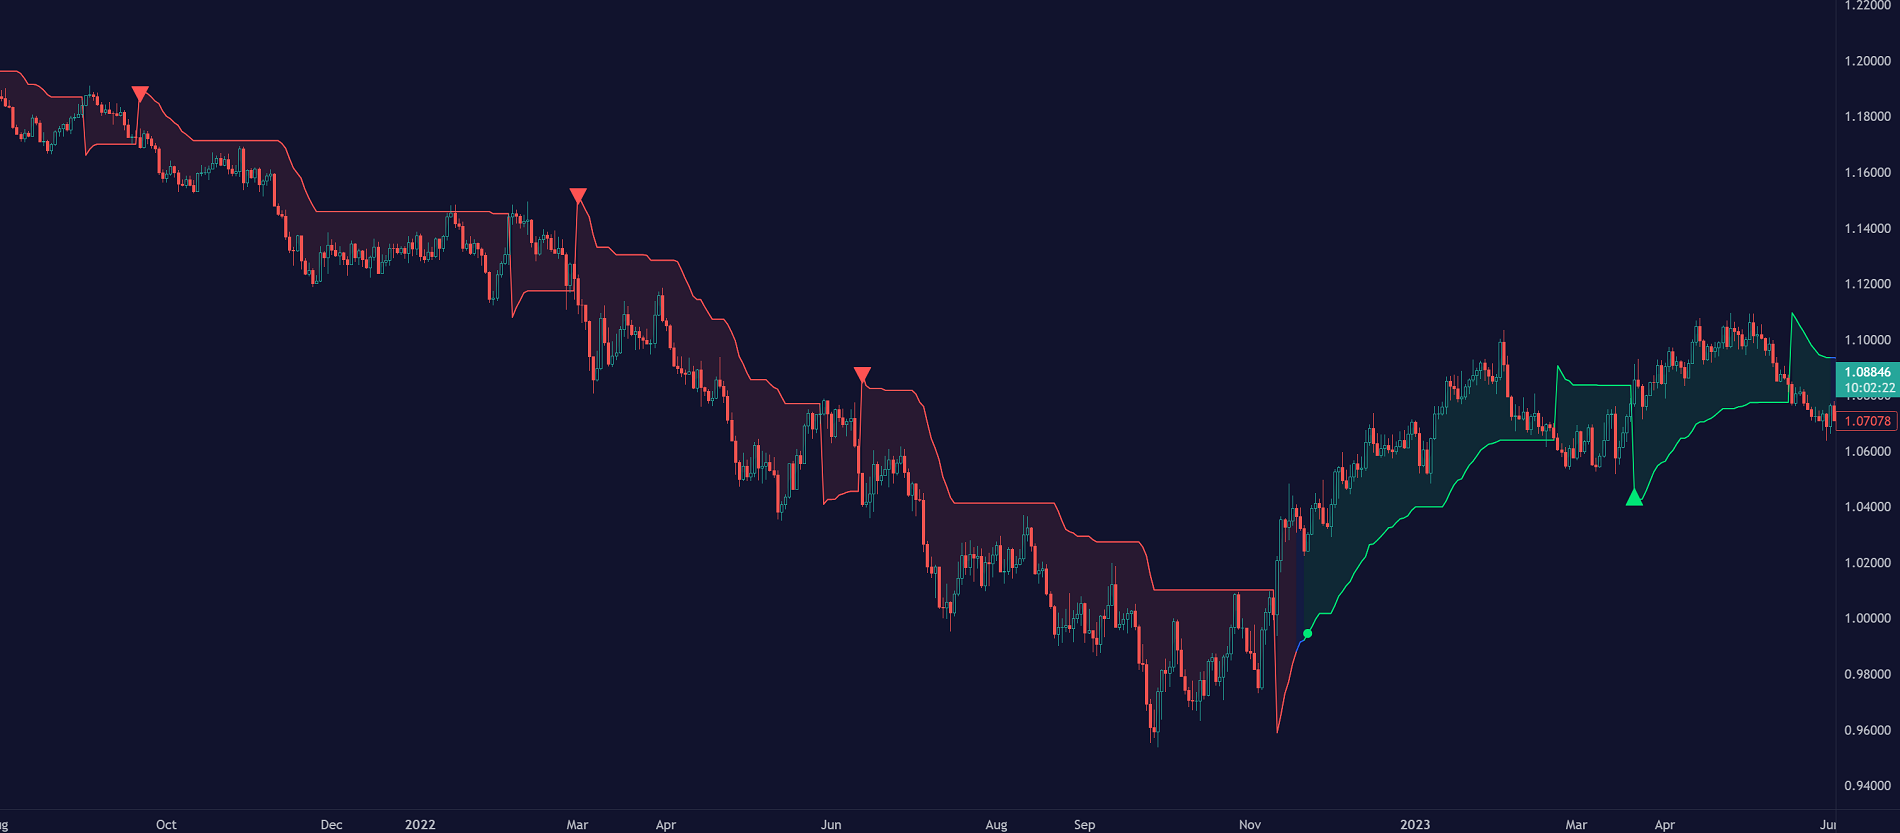
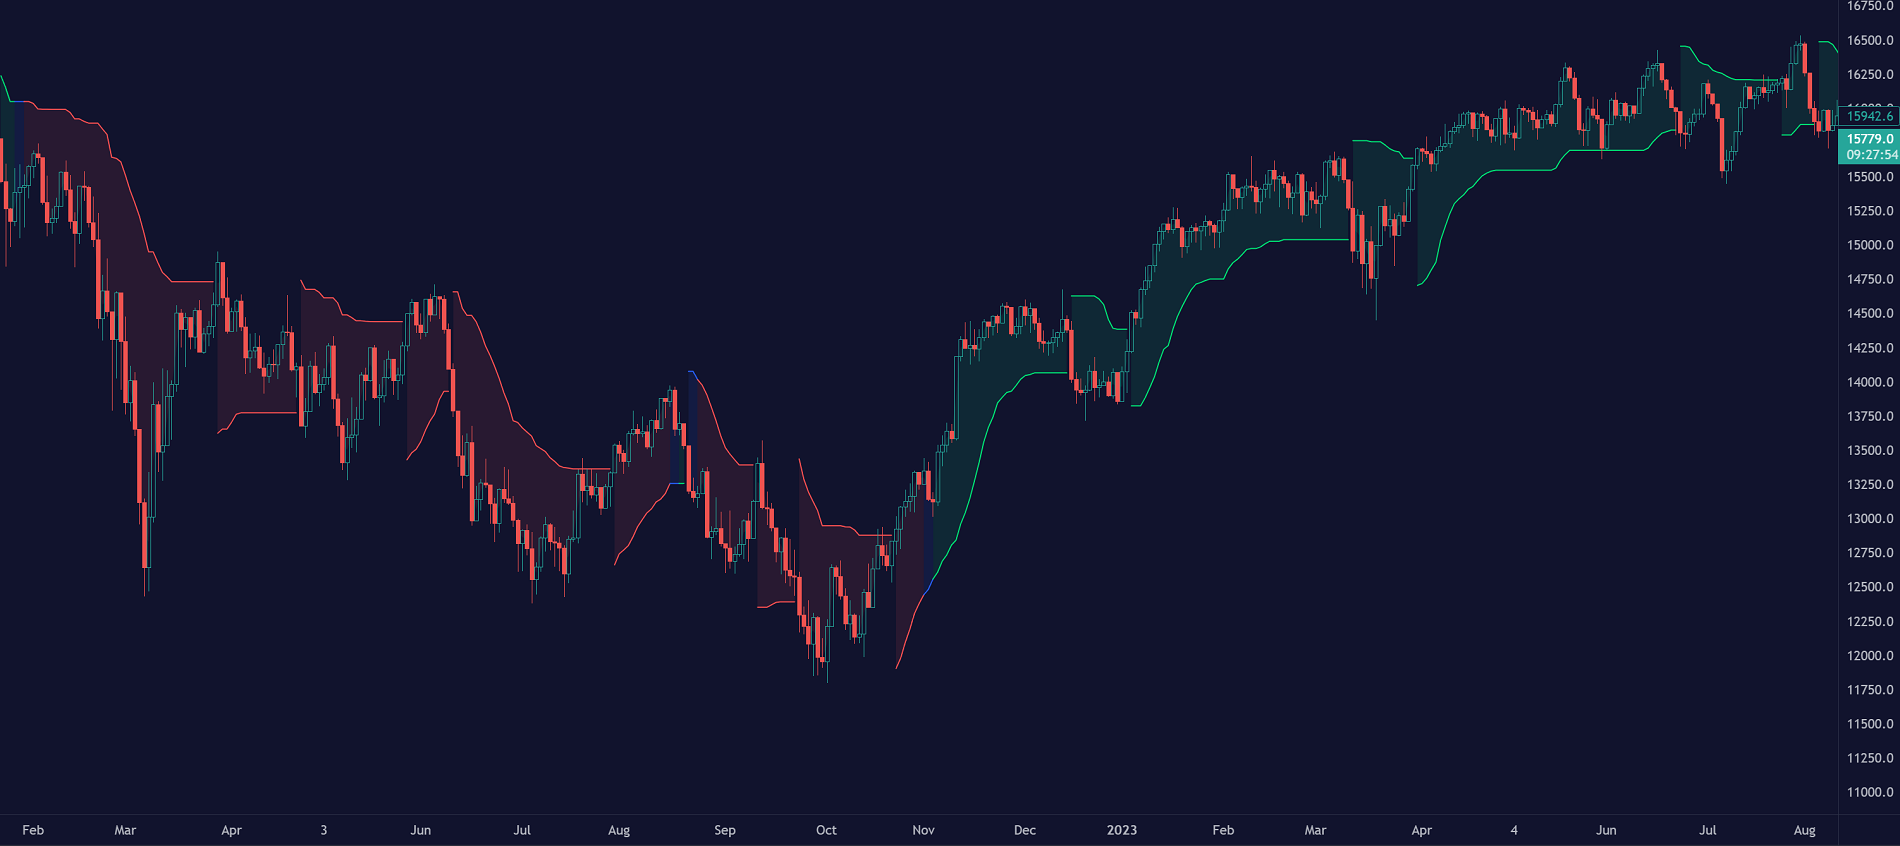
Der AI-Indikator Volume SuperTrend berücksichtigt nicht nur die Preisbewegung, sondern auch das Handelsvolumen, was der Trendanalyse eine zusätzliche Dimension verleiht. Durch die Integration von Volumendaten bietet der Indikator ein nuancierteres und robusteres Verständnis von Markttrends. Wenn Trends durch hohe Handelsvolumina unterstützt werden, sind sie in der Regel stabiler und zuverlässiger. In der Praxis deutet eine grüne Linie, die unterhalb des Kurses angezeigt wird, in der Regel auf einen Aufwärtstrend hin und spiegelt eine bullische Marktstimmung wider. Umgekehrt signalisiert eine rote Linie oberhalb des Kurses einen Abwärtstrend, der auf eine Baisse hindeutet.
Abbildung 2
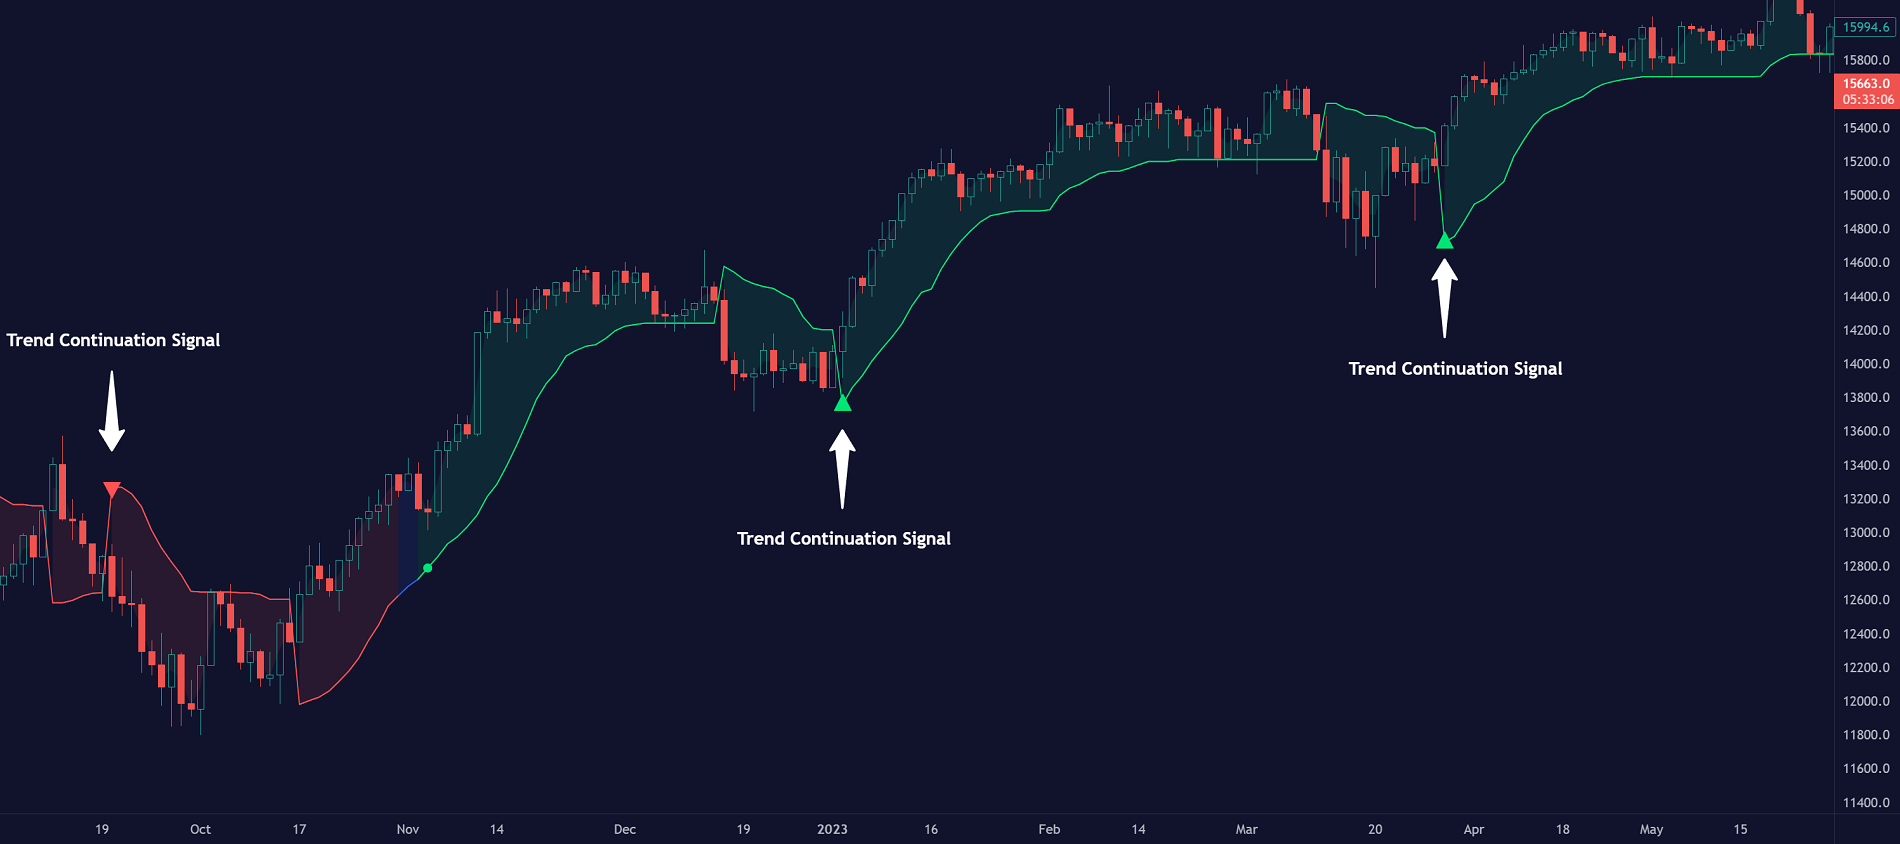
Trendfortsetzungssignale
Der KI-Algorithmus ist die grundlegende Komponente bei der Färbung des Volume SuperTrend. Diese Integration dient als Mittel zur Vorhersage des Trends, wobei die inhärenten Merkmale des SuperTrends erhalten bleiben. Durch die Beibehaltung dieser wesentlichen Merkmale ermöglicht der KI-verbesserte Volume SuperTrend Händlern, Trendfortsetzungssignale genauer zu erkennen und zu nutzen.
Bild 3
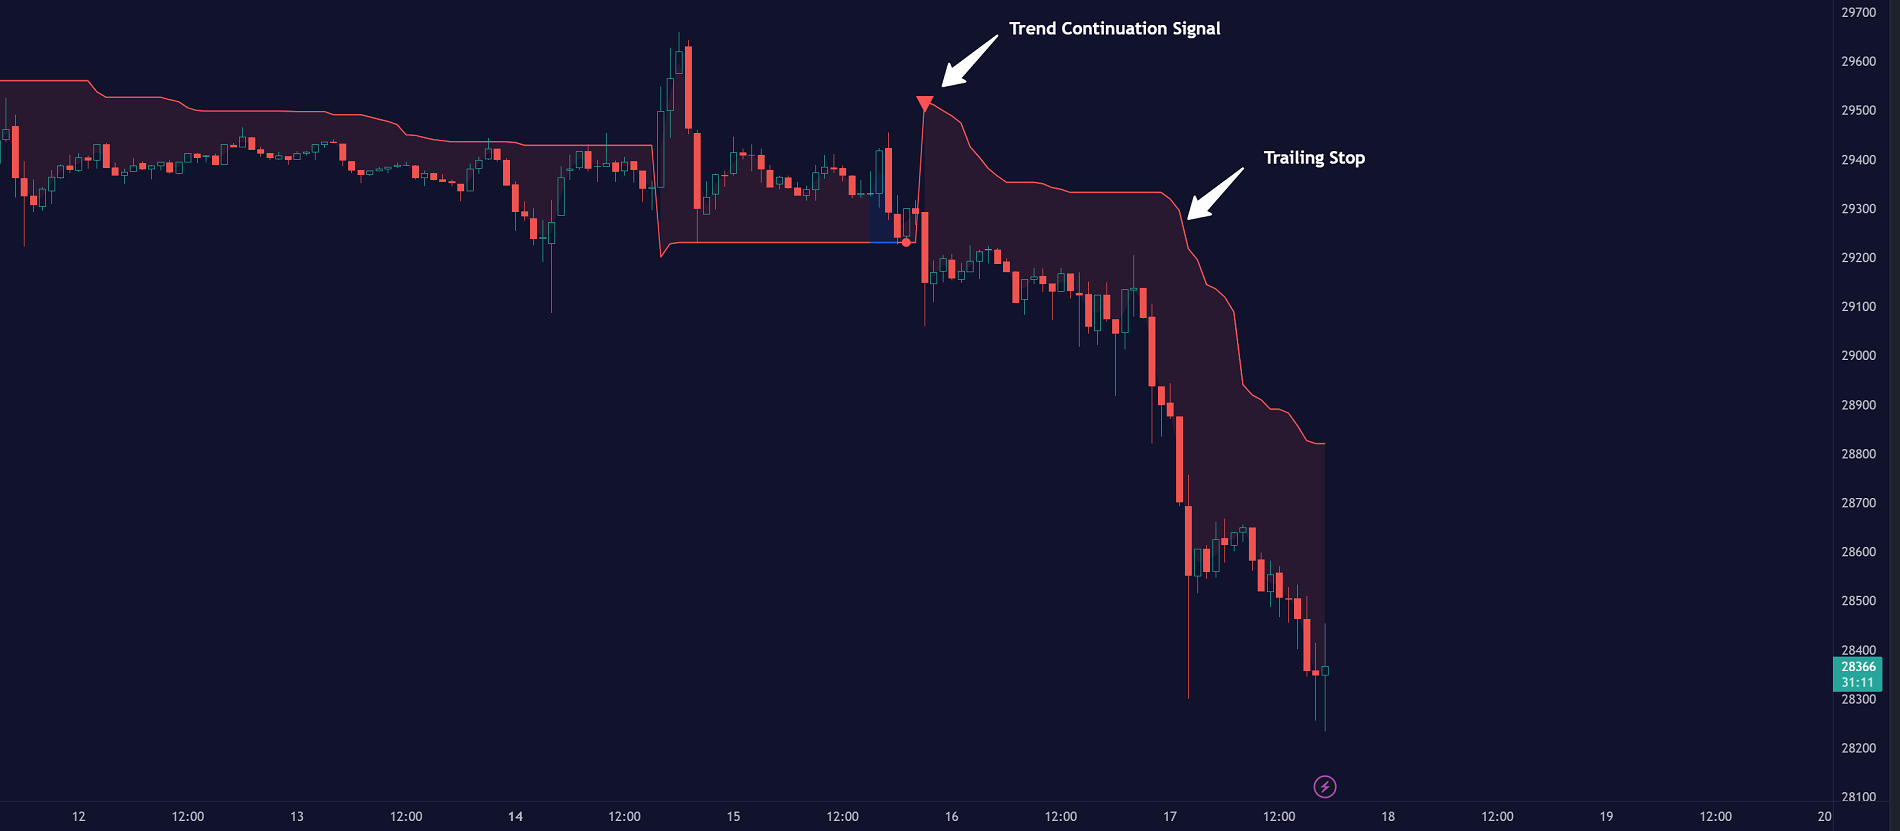
TrailingStop
Der AI-Indikator Volume SuperTrend dient als dynamischer Trailing-Stop-Loss, der sich sowohl an die Preisbewegung als auch an das Handelsvolumen anpasst. Dieser Ansatz schützt die Gewinne und ermöglicht gleichzeitig eine Erweiterung des Handelsspielraums unter Berücksichtigung des Volumens für eine nuanciertere Reaktion auf Marktveränderungen.
Bild 4
"Einstellungen
AI-Einstellungen:
Nachbarn (k):
Diese Einstellung steuert die Anzahl der nächsten Nachbarn, die beim k-Nächste-Nachbarn-Algorithmus (k-NN) berücksichtigt werden. Durch die Anpassung dieses Parameters können Sie die Empfindlichkeit des Modells gegenüber lokalen Schwankungen in den Daten direkt beeinflussen. Ein niedriger Wert von k kann zu Vorhersagen führen, die kurzfristigen Trends genau folgen, aber anfällig für Rauschen sein können. Ein höherer Wert von k kann stabilere Vorhersagen liefern, die den breiteren Kontext der Markttrends berücksichtigen, aber möglicherweise in der Reaktionsfähigkeit zurückbleiben.
Daten (n):
Diese Einstellung bezieht sich auf die Anzahl der Datenpunkte, die im Modell berücksichtigt werden. Sie ermöglicht es dem Benutzer, die Größe des zu analysierenden Datensatzes zu definieren. Ein größerer Wert von n kann zu umfassenderen Erkenntnissen führen, da ein breiterer historischer Kontext berücksichtigt wird, kann aber auch die Komplexität der Berechnungen erhöhen. Ein kleinerer Wert von n konzentriert sich auf aktuellere Daten und liefert möglicherweise schnellere Erkenntnisse, kann aber längerfristige Trends übersehen.
AI-Trend-Einstellungen:
Preistrend & Vorhersagetrend:
Mit diesen Einstellungen können Sie die Länge der gewichteten gleitenden Durchschnitte anpassen, die zur Berechnung des Preistrends und des Vorhersagetrends verwendet werden. Je kürzer sie sind, desto stärker reagieren die Trends auf die jüngsten Preisänderungen, wodurch schnelle Marktbewegungen erfasst werden. Längere Längen glätten die Trends, filtern Rauschen heraus und heben beständigere Marktrichtungen hervor.
KI-Trendsignale:
Diese Umschaltoption aktiviert oder deaktiviert die von der KI generierten Trendsignale. Die Aktivierung dieser Funktion kann Händlern helfen, wichtige Trendverschiebungen und Einstiegs- oder Ausstiegsmöglichkeiten zu erkennen. Die Deaktivierung kann vorzuziehen sein, wenn Sie sich auf andere Aspekte der Analyse konzentrieren möchten.
Super-Trend-Einstellungen:
Länge:
Diese Einstellung bestimmt die Länge des SuperTrends, die sich darauf auswirkt, wie er auf Preisänderungen reagiert. Eine kürzere Länge erzeugt einen empfindlicheren SuperTrend, der schnell auf Preisschwankungen reagiert. Eine längere Länge erzeugt einen gleichmäßigeren SuperTrend, der Fehlalarme reduziert, aber möglicherweise hinter echten Marktveränderungen zurückbleibt.
Faktor:
Dieser Parameter ist der Multiplikator für die Average True Range (ATR) in der SuperTrend-Berechnung. Durch die Anpassung des Faktors können Sie den Abstand des SuperTrends zum Kurs steuern. Ein höherer Faktor sorgt dafür, dass der SuperTrend weiter vom Kurs entfernt ist, wodurch mehr Spielraum für Kursbewegungen entsteht, aber möglicherweise kurzfristige Signale übersehen werden. Ein niedrigerer Faktor bringt den SuperTrend näher an den Kurs, wodurch er reaktiver wird, aber möglicherweise anfälliger für Fehlsignale ist.
Gleitender Durchschnitt Quelle:
Mit dieser Einstellung können Sie den Typ des gleitenden Durchschnitts wählen, der für die SuperTrend-Berechnung verwendet wird, wie z. B. Einfacher gleitender Durchschnitt (SMA), Exponentieller gleitender Durchschnitt (EMA) usw.
Verschiedene Typen gleitender Durchschnitte verleihen dem SuperTrend verschiedene Eigenschaften und ermöglichen eine Anpassung an individuelle Handelsstrategien und Marktbedingungen.
Farbeinstellungen: In der Puffereinstellung (Index 0 ist Linienfarbe) 0: Aufwärtstrend, 1: Abwärtstrend