BBandsEx
- Indikatoren
- Version: 1.12
- Aktualisiert: 17 November 2021
- Aktivierungen: 5

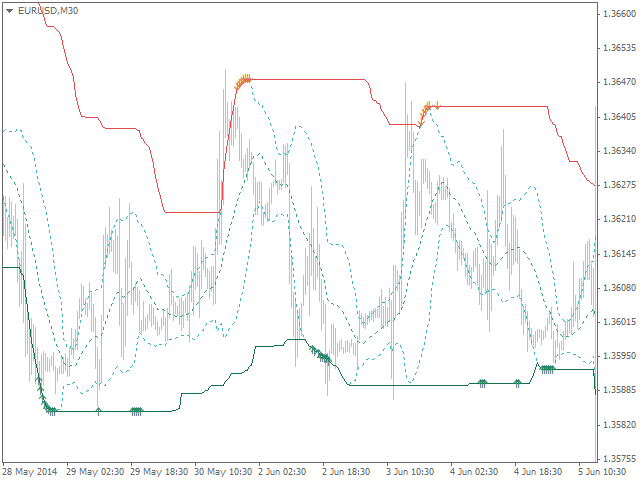
Erweiterter Bollinger Bands® (BB) Indikator.
Der Standard-Bands.mq4-Indikator wurde um eine Reihe von oberen/unteren Bändern und Signale für mögliche Umkehrungen ergänzt.
Parameter:
- BandsPeriod - Zeitraum des Indikators.
- BandsRange - Periode der Bestimmung des Bereichs.
- BandsDeviations - Anzahl der Standardabweichungen.
- Averaging Fast Period - schnelle Periode der Mittelwertbildung.
- Averaging Slow Period - langsamer Zeitraum für die Mittelwertbildung.
Puffer-Indizes:
- 0 - Mittlere Linie,
- 1 - Obere Linie,
- 2 - Untere Linie,
- 3 - Oberer Bereich,
- 4 - Unterer Bereich,
- 5 - Abwärtssignal,
- 6 - Aufwärtssignal.


Es lo que pedí, ahora voy a investigarlo a FONDO