KT Absolute Strength MT4
- Indikatoren
-
KEENBASE SOFTWARE SOLUTIONS
 Keenbase Trading entwickelt professionelle MetaTrader 4- und MetaTrader 5-Indikatoren sowie Expert Advisors, die Trader dabei unterstützen, fundiertere Handelsentscheidungen zu treffen.
 - Version: 1.0
- Aktivierungen: 10
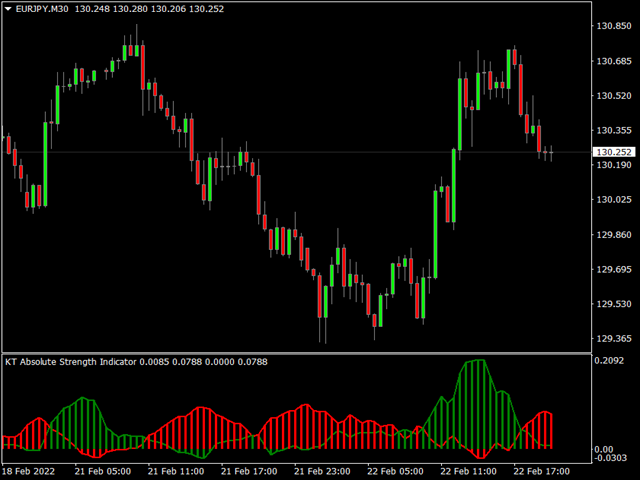
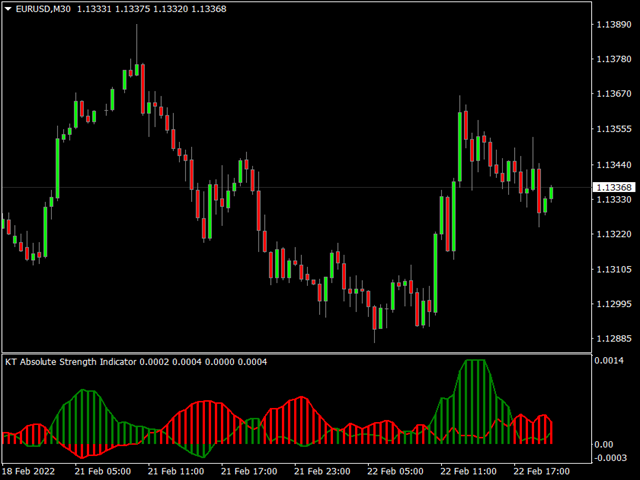
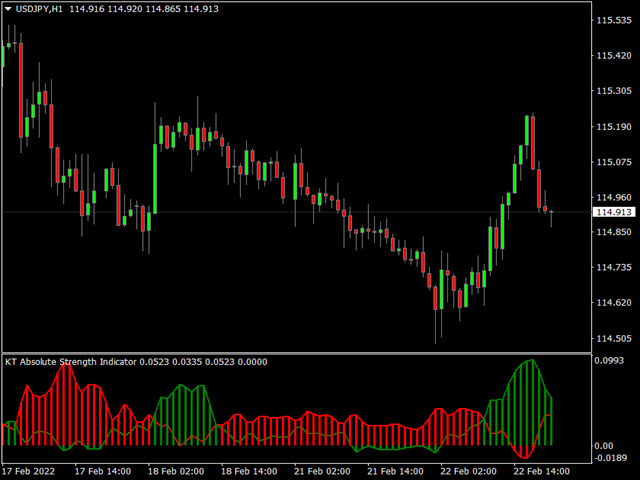
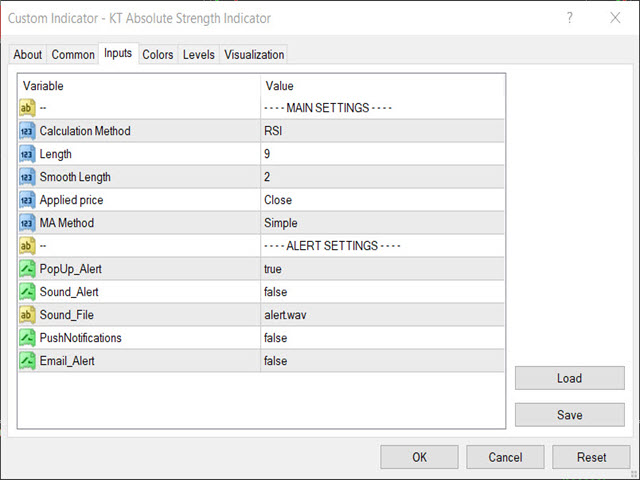
KT Absolute Strength misst und stellt die absolute Stärke der Kursbewegung des Instruments in Form eines Histogramms dar. Es kombiniert den gleitenden Durchschnitt und das Histogramm für eine aussagekräftige Darstellung. Es unterstützt zwei Modi für die Histogrammberechnung, d.h. es kann sowohl mit dem RSI als auch mit der Stochastik berechnet werden. Für eine dynamischere Analyse wird jedoch immer der RSI-Modus bevorzugt.
Einstieg kaufen
Wenn das Histogramm der absoluten Stärke grün wird und höher ist als die vorherige rote Spalte.
Einstieg verkaufen
Wenn das Histogramm der absoluten Stärke rot wird und auch höher ist als die vorherige grüne Spalte.
Vorteile
- Händler können damit die neu entstehenden Trends auf dem Markt erkennen.
- Keine komplexen Eingabeeinstellungen.
- Bietet im Vergleich zu anderen Trendindikatoren gute Einstiegsmöglichkeiten.
Nachteile
- Es handelt sich um einen nachlaufenden Indikator, der manchmal erst sehr spät Signale liefert.
- Er ist anfällig für Fehlsignale; wir empfehlen immer, ihn mit einer Kombination anderer Indikatoren zu verwenden.