Konstenfreie technische Indikatoren für den MetaTrader 4 - 9

Der MP Candle Countdown-Indikator mit Fortschrittsbalken ist ein Hilfsmittel für die technische Analyse, das die verbleibende Zeit bis zum Schließen der aktuellen Kerze auf einem Diagramm anzeigt, zusammen mit einem Fortschrittsbalken, der die seit dem Öffnen der Kerze verstrichene Zeit visuell darstellt. Dieser Indikator kann für Händler, die Candlestick-Charts verwenden, um Handelsentscheidungen zu treffen, hilfreich sein, da er sowohl die verbleibende Zeit bis zum Schließen einer Kerze als a
FREE

Wie der Name Strength schon sagt , ist dieser Indikator ein erschwingliches Handelsinstrument denn mit der Hilfe von Beliebte Entwickler & Unterstützung der M Q L Plattform Ich habe diese Strategie programmiert. Ich habe versucht, verschiedene Arten und verschiedene Zeiträume der Berechnung in Bezug auf Unterstützung, Widerstand, Trends, Trendlinien, Währungsstärke, überkaufte und überverkaufte Indikatoren für gute Ergebnisse einzugeben. Darüber hinaus habe ich auch auf folgende Punkte geachtet
FREE
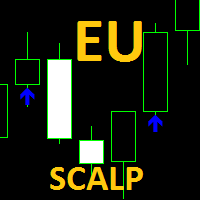
Scalping-Indikator mit Warnungen:
Der EU Scalp Indikator ist eine Kombination aus zwei Arbeitssätzen , der erste ist so voreingestellt , dass er gegen die Richtung der Preisbewegung arbeitet und der zweite arbeitet auf die Richtung der Preisbewegung , basierend auf der Wahrscheinlichkeit von Preisschwankungen oder Ausbrüchen , die bei auftreten wichtige Handelsstufen.
Die Standardeinstellungen sind für das EurUsd-Paar M5 Timeframe optimiert, weitere Einstellungen finden Sie im Abschnitt "Komm
FREE

Der Fisher Yur4ik Indikator ist ein Momentum-Indikator, der von Yuri Prokiev (Russisch) entwickelt wurde. Ich habe den Fisher-Test-Indikator mit anderen Indikatoren kombiniert, um Signale auszusieben/zu filtern. Er wird nicht als eigenständiger Indikator verwendet, sondern in Kombination, um Price Action Signale herauszufiltern. Ich habe diesen Indikator (Fisher Test) zusammen mit dem Signalindikator 3Bar_Play zum Download hochgeladen, damit Signale angezeigt werden. Er ist kostenlos.
FREE

Dies ist eine unkonventionelle Version des Heiken Ashi Smoothed-Indikators , der als Linien statt als Histogramm implementiert ist. Im Gegensatz zu einem üblichen Histogramm zeichnet der Indikator die Messwerte der beiden gleitenden Durchschnitte in Form von farbigen Linien.
Beispiel Wenn die Kerze zwei Indikatorlinien nach oben kreuzt, wird davon ausgegangen, dass der Trend von bärisch nach bullisch wechselt. Wenn die Kerze zwei Indikatorlinien nach unten kreuzt, wird davon ausgegangen, dass s
FREE

Marktstatus Dashboard: Das ultimative 7-in-1 Trading Dashboard für alle Märkte.
Hören Sie auf, die Marktrichtung zu erraten. Beginnen Sie den Handel mit confluence. Market State Dashboard ist nicht nur ein Signalindikator, sondern ein komplettes Entscheidungsunterstützungssystem für ernsthafte Trader . Die meisten Trader scheitern, weil sie Strategien isoliert betrachten. Sie kaufen aufgrund eines RSI-Kreuzes und ignorieren, dass der Trend nach unten zeigt. Sie verkaufen aufgrund einer Trend
FREE

Alan Hulls gleitender Durchschnitt, reagiert empfindlicher auf die aktuelle Preisaktivität als der normale MA. Reagiert schneller auf den Trendwechsel, zeigt die Kursbewegung deutlicher an. Farbige Version des Indikators. Verbesserung der ursprünglichen Version des Indikators von Sergey <wizardserg@mail.ru>. Geeignet für alle Zeitrahmen.
Parameter Periode - Glättungsperiode, empfohlene Werte liegen zwischen 9 und 64. Je größer die Periode, desto glatter der Indikator. Methode - Glättungsmethode
FREE

Haben Sie genug vom Zeichnen von Trendlinien? Der PZ TrendLines-Indikator verwendet einen mechanischen Ansatz für die Konstruktion von Trendlinien für Sie! [ Installationsanleitung | Aktualisierungsanleitung | Fehlerbehebung | FAQ | Alle Produkte ] Es können bis zu 18 Trendlinien gezeichnet werden Trendlinien können optional auf Fraktalen basieren Jede Linie stellt ein Ausbruchsniveau dar Jede Trendlinie kann gebrochen oder verworfen werden Konfigurierbare Anzahl von Linien Konfigurierbare Farbe
FREE

Flag Pattern Indicator - Ihr Leitfaden zum Erkennen profitabler Handels-Setups Willkommen in der Welt des Präzisionshandels mit dem "Flag Pattern Indicator". Dieses leistungsstarke Tool wurde für den MetaTrader entwickelt und ist Ihre erste Wahl, um eines der zuverlässigsten und vielseitigsten Chartmuster der technischen Analyse zu erkennen: das Flaggenmuster. Egal, ob Sie ein erfahrener Trader sind oder gerade erst anfangen, dieser Indikator vereinfacht das Erkennen von Flaggenmustern und versc
FREE
Was ist der ADX_DI-Indikator? ADX_DI ist ein fortschrittlicher Indikator für die technische Analyse, der für die MetaTrader-Plattform entwickelt wurde. Er kombiniert die Komponenten Average Directional Index und Directional Indicator, um die Stärke und Richtung des Markttrends zu analysieren. Was macht er? Misst die Trendstärke : Die ADX-Linie zeigt die Stärke des Markttrends an Bestimmt die Richtung : DI+ (grün) und DI- (rot) Linien identifizieren die Trendrichtung Erkennt Trendänderungen : DI+
FREE

Indikatoren sind für Trendfolger!
Ein Handelssystem, das aus drei gleitenden Durchschnitten aufgebaut ist. Handeln Sie mit dem Trend und lassen Sie die Gewinne laufen. Necessary for traders: tools and indicators Waves automatically calculate indicators, channel trend trading Perfect trend-wave automatic calculation channel calculation , MT4 Perfect trend-wave automatic calculation channel calculation , MT5 Local Trading copying Easy And Fast Copy , MT4 Easy And Fast Copy , MT5 Local Trading co
FREE
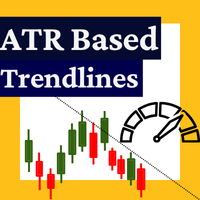
Dieser Indikator ist die konvertierte MetaTrader 4-Version des TradingView-Indikators "ATR Based Trendlines - JD" von Duyck. Funktionsweise:
Der Indikator zeichnet automatisch und kontinuierlich Trendlinien, die nicht ausschließlich auf dem Preis basieren, sondern auch auf der vom ATR wahrgenommenen Volatilität. Somit wird der Winkel der Trendlinien durch (einen Prozentsatz des) ATR bestimmt. Der Neigungswinkel folgt den Preisänderungen, die durch den ATR zum Zeitpunkt der Pivot-Punkterkennung v
FREE
Hochgradig konfigurierbarer gleitender Durchschnittsindikator.
Merkmale: Hochgradig anpassbare Alarmfunktionen (bei Levels, Kreuzen, Richtungsänderungen per E-Mail, Push, Sound, Popup) Multi-Timeframe-Fähigkeit Farbanpassung (bei Niveaus, Kreuzen, Richtungsänderungen) Option für lineare Interpolation Funktioniert im Strategie-Tester im Multi-Timeframe-Modus (auch am Wochenende ohne Ticks) Parameter:
MA Timeframe: Sie können den unteren/höheren Zeitrahmen für MA einstellen. MA Bar Shift: Sie kön
FREE

Schattensystem-Kerzen - AI-Trendvisualisierung
Konzept "Handeln Sie nicht mehr im Dunkeln. Rüsten Sie Ihren Chart mit Nachtsicht aus."
Shadow System Candles ist der visuelle Kern des Projekts "Shadow Operation". Es eliminiert das Marktrauschen und visualisiert die wahre Richtung des Trends mit Hilfe einer KI-basierten Logik (ADX + MA Integration).
Hinweis: Dieses Tool generiert keine Kauf-/Verkaufspfeile. Es wurde entwickelt, um Ihre Augen zu schulen, um "aktive Trends" und "gefährliche Bere
FREE
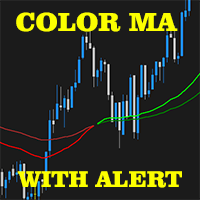
Der 2 EMA Color Alerts-Indikator ist ein leistungsfähiges Instrument für jeden Händler, der die Marktbewegungen im Auge behalten möchte. Durch die Verwendung exponentiell gleitender Durchschnitte (EMAs) kann dieser Indikator Frühwarnsignale für potenzielle Marktumkehrungen und Trendwechsel liefern. Eines der Hauptmerkmale des 2 EMA Color Alerts Indikators sind die anpassbaren Warnungen. Mit dieser Funktion können Händler ihre eigenen Parameter für den Erhalt von Warnungen festlegen, wie z. B. d
FREE
Indikator für Zyklus-Signale. Gibt Signal auf Preisbereich Radfahren und geglättet mit Algorithmus. Es gibt sehr kleine Parameter: Erlauben Sie Warnungen (Pop-Up oder E-Mail), Farben für Chart-Pfeile, Zeitrahmen für die Berechnung zu verwenden (aber besser, aktuelle Zeitrahmen zu verwenden). Und der wichtigste Parameter ist "Periode". Für niedrige Timeframes werden hohe Werte empfohlen. Die aktuelle Periode ist gut für M5. Verringern Sie ihn für höhere Zeitrahmen. Close-Trade-Pfeile werden bald
FREE

www. tradepositive.lat
ALGO Smart Flow Structure Indicator Der institutionelle Standard für die Marktstruktur. Dieser Indikator wurde für ernsthafte SMC- (Smart Money Concepts) und Price Action-Händler entwickelt und eliminiert das Rauschen herkömmlicher Fraktale. Vergessen Sie nachmalende Signale und Mehrdeutigkeit; erhalten Sie einen kristallklaren Blick auf die reale Marktstruktur , validiert durch strenge algorithmische Regeln. Das Bias Dashboard Treffen Sie fundierte Entscheidungen
FREE
Bleiben Sie dem Marktmomentum voraus mit dem Pip Movement Alert MT4, einem vielseitigen Mehrwährungsindikator, der entwickelt wurde, um präzise Pip-Bewegungen über mehrere Symbole hinweg zu verfolgen und Trader zu benachrichtigen, ideal für den Handel mit Forex, Aktien, Kryptowährungen und Rohstoffen. In Handelsgemeinschaften wie Forex Factory und Reddit’s r/Forex gefeiert und in Diskussionen auf Investopedia und TradingView für seine Fähigkeit, plötzliche Marktveränderungen zu erkennen, hervorg
FREE

Genauigkeitsmesser Einführung:
Das Genauigkeitsmessgerät ist ein leistungsstarkes Tool, mit dem Sie den Gewinn% der Strategien bestimmen können. Um Ihnen alle Trades-Ein- und Ausstiegspunkte wie den Meta-Trader-Strategietester anzuzeigen, können Sie einen einfachen Strategietester als Indikator auf dem Chart haben, ihn an verschiedene Paare und Zeitrahmen anhängen und herausfinden Ihre Strategiegenauigkeit in Prozent, ändern Sie den Stop-Loss und das Risiko, um den Faktor zu belohnen, und sehen
FREE

Der SuperTrend-Indikator ist ein trendfolgendes technisches Tool, das Trendwechsel im Markt visuell hervorhebt. Die Farbe und Position der Linien ändern sich automatisch in Abhängigkeit von den Kursbewegungen und unterstützen so bei der Entscheidung von Ein- und Ausstiegen. Dank seines einfachen Designs kann er in verschiedenen Handelsstilen sowohl manuell als auch automatisiert eingesetzt werden. Hauptmerkmale Klare Anzeige von Trendwechseln
In Aufwärtstrends wird die Linie unterhalb der Kerze
FREE
Forex and Gold OBI ist ein innovativer Indikator, der auf einer Studie der Preis- und Marktdynamik basiert und den RSI-Indikator verwendet. Dieser Indikator hilft Ihnen, den besten Zeitpunkt für den Einstieg in den Devisenmarkt zu finden, indem er Ihnen signalisiert, wann sich der Markt in einem überkauften oder überverkauften Zustand befindet. Außerdem berechnet der Indikator zwei mögliche Ziele und den Stop-Loss für jeden Handel, so dass Sie Ihr Risiko-Ertrags-Verhältnis optimieren können. Pre
FREE

Wenn Sie dieses Projekt mögen, hinterlassen Sie eine 5-Sterne-Bewertung. Da die Institutionen große Mengen tauschen, ist es für sie nicht ungewöhnlich,
zu versuchen,
ihre Position auf bestimmten Prozentebenen verteidigen. Diese Ebenen dienen als natürliche Unterstützung und Widerstand, die Sie
verwenden können
entweder um einen Handel zu betreten oder sich über mögliche Gefahren gegen Ihre
Position bewusst zu sein. Ein Beispiel für einen gebräuchlichen Prozentsatz sind 0,25% und 0,50% auf
EU
FREE

Steigern Sie Ihre Fähigkeiten zur Trendbestimmung mit dem Consecutive Candle Indicator MT4, einem dynamischen Tool, das darauf ausgelegt ist, Serien von bullischen oder bärischen Kerzen zu identifizieren und zeitnahe Warnungen für Trendbestätigungen und potenzielle Umkehrungen in Forex-, Aktien-, Krypto- und Rohstoffmärkten zu liefern. In Handelsgemeinschaften wie Forex Factory und Reddit’s r/Forex gefeiert und in Diskussionen auf Investopedia und TradingView für seine Fähigkeit zur Vereinfachun
FREE
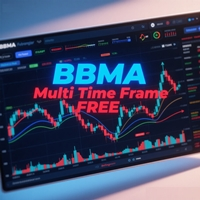
LINK : https://linktr.ee/ARFXTools;
BBMA + SMC TRADING FLOW (Smart & Simple) 1. IDENTIFY THE MAIN TREND (Multi Time Frame) Verwenden Sie Indikatoren: BBMA MTF PANEL (Überprüfung der Trendrichtung auf MN, W1, D1, H4) Handeln Sie nur , wenn D1 und H4 in dieselbe Richtung gehen . Beispiel :
Wenn D1 = Kaufen und H4 = Kaufen → Nur auf Reentry Buy konzentrieren 2. WARTEN AUF CSA + CSM (gültiges Entry Setup) CSA-Kauf : Kerze schließt außerhalb des unteren Bollinger Bandes + MA5-Tief > MA10-
FREE

Der Indikator, der die aktuelle Uhrzeit auf den wichtigsten Märkten der Welt anzeigt. Es zeigt auch die aktuelle Sitzung an. Sehr einfach zu bedienen. Es nimmt nicht viel Platz auf einem Diagramm ein. Es kann zusammen mit Expert Advisors und anderen Panels wie VirtualTradePad verwendet werden . Die Version mit analoger Uhranzeige auf der Karte. Liebe Freunde und Benutzer unserer EAs, bitte fügen Sie Ihre Bewertungen im Abschnitt Bewertungen hinzu. Alle Updates unserer Forex-Software sind
FREE

Touch VWAP ist ein Indikator, der es Ihnen ermöglicht, einen volumengewichteten Durchschnittspreis (VWAP) zu berechnen, indem Sie einfach die Taste "w" auf Ihrer Tastatur drücken und dann auf die Kerze klicken, die Sie berechnen möchten. Wenn Sie unter der Kerze klicken, wird der VWAP auf der Grundlage des Tiefstpreises mit dem Volumen berechnet, Wenn Sie auf den Kerzenkörper klicken, wird der VWAP auf der Grundlage des Durchschnittspreises und des Volumens berechnet, und wenn Sie auf die Kerze
FREE

ADX Channel ist ein Indikator, der den Kanal in Abhängigkeit von den Werten des ADX-Indikators (Average Directional Movement Index) aufzeichnet. Der sich ergebende Kanal ähnelt ein wenig den Envelopes, aber seine Linien hängen von der Marktvolatilität ab. Der Verkauf wird in der Regel schnell ausgeführt, wenn der Kurs die obere Linie des Kanals berührt und von ihr abprallt, der Kauf - von der unteren Linie. Es wird empfohlen, zu handeln, wenn es keine bedeutenden Nachrichten gibt. Die empfohlene
FREE

Fraktalindikator für mehrere Zeitrahmen, der den Fraktalpunkt des höheren Zeitrahmens auf den niedrigeren Zeitrahmen anzeigt.
Parameter Fraktal_Zeitrahmen : Sie können die höheren Timeframes für Fraktale festlegen. Maxbar : Sie können die maximale Anzahl von Kerzen für die Berechnungen festlegen. Auf_Fraktal_Farbe, Auf_Fraktal_Symbol, Ab_Fraktal_Farbe, Ab_Fraktal_Symbol : Farb- und Stileinstellungen für die Fraktalpunkte. Linie_erweitern : Zeichnet eine horizontale Linie vom vorherigen Fraktalp
FREE

Dieses Meisterwerk verbindet modernste Advance MA-, HMA- und Momentum-Logik zu atemberaubenden Goldstar-Signalen, die Ihnen die Möglichkeit geben, Marktveränderungen ohne Rätselraten zu erkennen. Dieses Tool ist perfekt für jeden Händler - ob Anfänger oder Experte - und verwandelt Ihre XAUUSD-Charts in eine Goldmine der Möglichkeiten. Handeln Sie nicht nur - leben Sie!
Warum Sie es lieben werden
Kristallklare Signale : Goldstern-Warnungen heben wichtige Marktmomente hervor und erleichtern Ihr
FREE

ZigZag WaveSize – ein modifizierter Standard-ZigZag-Indikator mit zusätzlichen Informationen zur Wellenlänge in Punkten.
Besonderheiten: Optimierte Online-Konstruktionslogik: Beschriftungen werden nicht bei jedem Tick von Grund auf neu gezeichnet, sondern arbeiten parallel zur Hauptberechnung und zeichnen nur die letzten Beschriftungen, wenn ZigZag neue Linien zeichnet oder sie aktualisiert. Ein weiterer Berechnungsmodus in Punkten wurde hinzugefügt: Die Linie wird erstellt, wenn sie die in de
FREE

Der Zwei-Perioden-RSI vergleicht langfristige und kurzfristige RSI-Linien und stellt zur besseren Visualisierung eine Füllung zwischen ihnen dar. Die Füllung ist je nach Aufwärtstrend (RSI der kurzen Periode über dem RSI der langen Periode) oder Abwärtstrend (RSI der kurzen Periode unter dem RSI der langen Periode) unterschiedlich gefärbt. Der kurzfristige RSI, der den langfristigen RSI kreuzt, liefert ein robusteres Trendbestätigungssignal als der RSI für eine einzelne Periode. Dies ist ein kle
FREE
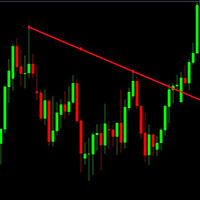
Dies ist nur ein einfacher Indikator, der eine Warnung anzeigt, wenn die aktuelle Kerze oberhalb der Trendlinie schließt. Vorherige Kerzen haben keinen Einfluss auf den Alarm. Der Indikator ist an die Trendlinie gebunden. Wenn die Trendlinie versehentlich gelöscht wird, funktioniert der Alarm nicht. Der Indikator wird eine neue Trendlinie zeichnen, wenn die aktuelle Trendlinie gelöscht wird. Wird der Indikator entfernt, wird auch die Trendlinie entfernt. Es können 4 Arten von Alarmen eingestellt
FREE

Dieser automatisierte DOJI BAR FINDER INDICATOR kann zur Verwaltung von Trades und zur Identifizierung potenzieller Unterstützungs- und Widerstandsbereiche sowohl für Käufe als auch für Verkäufe verwendet werden. Er wurde entwickelt, um Zonen für Kauf-/Verkaufstransaktionen zu identifizieren und kann effektiv in Verbindung mit anderen Indikatoren, wie z.B. Orderblock-Indikatoren, verwendet werden. Derzeit für MT4 entwickelt, wird er später an MT5 angepasst werden. Wir bieten auch die Möglichkeit
FREE

--- KOSTENLOSE VERSION - FUNKTIONIERT NUR AUF EURUSD
------------------------------------------------------------------- Dies ist eine einzigartige Ausbruchsstrategie, die zur Bestimmung des nächsten kurzfristigen Trends/der nächsten Bewegung verwendet wird. Das vollständige System ist auf MQL5 unter dem Namen "Forecast System" verfügbar. Hier ist der Link --> https://www.mql5.com/en/market/product/104166?source=Site Ein Backtest ist nicht möglich, da die Berechnungen auf der Grundlage der Daten
FREE

Ein Kraftpaket für den Handel: Erkennung von Trends, Umkehrungen und Erschöpfungen
Dieser Indikator ist eine persönliche Implementierung des berühmten Traders Dynamic Index, der RSI, gleitende Durchschnitte und Volatilitätsbänder verwendet, um Trends, Umkehrungen und Preiserschöpfungen zu erkennen. Diese spezielle Implementierung unterstützt jedoch nicht nur den RSI, sondern auch viele andere. Er eignet sich für Scalping, Day-Trading und Swing-Trading und zielt darauf ab, ein vollständiges Bild
FREE

Dieser Weis-Wave-Volumen-Indikator ist ein Instrument, das Händlern hilft, den aktuellen Preistrend zu erkennen. Das Verständnis des Volumens kann Ihnen einen Einblick in das Verhalten eines Marktes geben und Ihnen helfen, seine allgemeine Gesundheit zu bestimmen. Die wichtigste Regel lautet: Das Volumen geht dem Preis voraus. Bevor sich ein Marktpreis bewegt, kommt in der Regel das Volumen ins Spiel. Das Histogramm hat 2 Hauptfarben, nämlich grün und rot. - Grün zeigt eine Aufwärtswelle an. Je
FREE
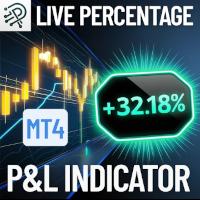
Überwachen Sie Ihren gleitenden Gewinn oder Verlust als Prozentsatz Ihres Kontosaldos live und immer sichtbar direkt auf Ihrem Chart! Hauptmerkmale: Echtzeit-Berechnung: Berechnet sofort den kombinierten variablen Gewinn oder Verlust aus allen offenen Geschäften als Prozentsatz Ihres aktuellen Kontosaldos. Einfache Anzeige auf dem Chart: Das Ergebnis wird bequem als Etikett in der unteren rechten Ecke Ihres Charts angezeigt - keine Ablenkung, immer sichtbar. Klare Farbkodierung: Grün für Gewinn
FREE

Trendy Stock ist ein Preisverfolgungsindikator, der die Stochastik verwendet, um anzuzeigen, wann der Preis aus dem überverkauften oder überkauften Bereich heraus ist. Der Algorithmus ermöglicht es Ihnen, länger in einem Trend zu bleiben, wenn die Bullen oder Bären die Kontrolle haben. Der Indikator ändert seine Farbe, sobald der Preis den überverkauften/überkauften Bereich verlässt. Kurz gesagt, die [roten] Abwärtstrend-Balken beginnen zu malen, wenn der Kaufdruck nachlässt, während die [grüne
FREE
Fixed Time AVWAP (Free) - Grundlegende Analyse des fairen Preises Der Fixed Time AVWAP-Indikator ist ein wichtiges Instrument für jeden Trader, das auf dem Konzept des volumengewichteten Durchschnittspreises (VWAP) basiert. Wir stellen Ihnen eine genaue und zuverlässige AVWAP-Linie zur Verfügung, die zu einem vom Benutzer festgelegten Zeitpunkt berechnet wird und für die Bestimmung des aktuellen Marktwerts eines Vermögenswerts unerlässlich ist. VWAP verstehen: Warum brauchen Sie diesen Indikato
FREE
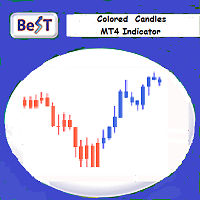
BeST_Colored Candles ist ein kostenloser MT4-Indikator , der die Farbe der Candlesticks basierend auf den MACD-, SAR- oder RSI-Werten und -Niveaus ändern kann. Es handelt sich um einen zusammengesetzten Indikator, der durch Auswahl die Werte jedes dieser 3 Indikatoren und ihre kritischen Niveaus verwendet, um numerische Beziehungen zu schaffen, die, wenn sie erfüllt sind, die entsprechende Färbung der Candlesticks verursachen.
Eingabeparameter
== Grundeinstellungen
-- Please Select Indicator
FREE

Der Χ15-Indikator ist ein MetaTrader 4-Tool, das es Ihnen ermöglicht, Ihre eigenen Strategien schnell, einfach und effizient zu erstellen und in Echtzeit zu testen . Es enthält 15 der beliebtesten technischen Analyse-Indikatoren , die Sie verwenden können, jeder auf eine andere Weise. Wählen Sie die Indikatoren, die Sie verwenden möchten, wählen Sie aus, wie Sie sie verwenden möchten, und Sie werden auf dem Chart KAUFEN (grün) und VERKAUFEN (rot) Pfeile sehen, die Ihre Strategie umsetzen. Wählen
FREE

Ständig zu überprüfen, ob Ihr RSI ein bestimmtes Niveau erreicht hat, kann manchmal mühsam und anstrengend sein, vor allem, wenn Sie verschiedene Anlageklassen gleichzeitig überwachen müssen. Der Alert-RSI-Indikator unterstützt Sie bei dieser Aufgabe und sorgt dafür, dass Sie mit wenig Aufwand das Maximum herausholen. Wenn die RSI-Werte ein bestimmtes Niveau erreichen, werden die Alarme ausgelöst, und zwar auf dem Chart, in der MT4-Telefon-App oder per E-Mail (Sie können Textnachrichten auf Ihr
FREE

Lisek Stochastik-Oszillator-Indikator mit Alarm, Push-Benachrichtigungen und E-Mail-Benachrichtigungen. Der Stochastik-Indikator ist ein Momentum-Indikator, der Ihnen anzeigt, wie stark oder schwach der aktuelle Trend ist. Er hilft Ihnen, überkaufte und überverkaufte Marktbedingungen innerhalb eines Trends zu erkennen. Der Stochastik-Indikator ist ein nachlaufender Indikator, d.h. er sagt nicht voraus, wohin sich der Kurs entwickelt, sondern liefert nur Daten darüber, wo der Kurs war!!!
Wie man
FREE

Der Handel mit Hilfe des MACD-Indikators ist jetzt noch bequemer geworden. Flexible Einstellungen helfen Ihnen, das auszuwählen, was Sie für Ihren Handel wirklich brauchen. Verwenden Sie die Strategie, die Sie brauchen - der Indikator verwendet 3 Strategien. Laden Sie die Demo gleich jetzt herunter! Ich empfehle Ihnen, sich meinen Berater anzusehen - Night Zen EA Abonnieren Sie meinen Telegram-Kanal, Link in meinem Profil Kontakte - mein Profil Siehe auch meine anderen Produkte auf mql5.com - me
FREE

Currency Strength Breakout Indikator
Verschaffen Sie sich einen Vorteil beim Trading mit dem Currency Strength Breakout Indikator , einem leistungsstarken Tool, das acht Währungen über mehrere Zeitrahmen hinweg (M1, M5, M15, M30 und H1) analysiert – alles in einem einzigen, übersichtlichen Fenster. Identifizieren Sie die stärksten und schwächsten Währungen und handeln Sie Rückläufe mit Präzision. Nutzen Sie Benachrichtigungen, um Trends zur richtigen Zeit zu betreten. Hauptmerkmale Echtzeit-Übe
FREE
Dieser fortschrittliche Indikator ist ein leistungsstarkes Instrument, das Händlern hilft, wichtige Unterstützungs- und Widerstandsniveaus auf dem Markt zu identifizieren. Dieser Indikator ist vielseitig und bietet eine anpassbare und intuitive Schnittstelle, die es dem Händler ermöglicht, zwischen sechs verschiedenen Methoden zur Berechnung des Pivot-Punkts zu wählen: Classic, Camarilla, Woodie, Floor, Fibonacci, Fibonacci Retracement.
FREE

Der Indikator zeigt die Preisverteilung in einem horizontalen Histogramm an. Das horizontale Histogramm hilft, die wichtigsten Kursniveaus herauszufinden, so dass Sie eine gute Entscheidung über die Festlegung der Take-Profit- und Stop-Loss-Punkte treffen können... Mit dem Preis-Histogramm können Sie Ihre bestehende Handelsstrategie verbessern oder eine neue Handelsidee entwickeln.
Herausragende Eigenschaften Unterstützung mehrerer Zeitrahmen : Sie können mit den historischen Daten in jedem gew
FREE

Key Levels + Zones
Der Indikator zeigt geradzahlige Kursniveaus sauber an: " 00s" und "50s". Zusätzlich können Sie "Mid-Lines" anzeigen, die voreingestellte Abstandsniveaus auf beiden Seiten der geradzahligen Kursniveaus sind (standardmäßig auf 12,5 Pips eingestellt). Diese 25-Pip-Zone, die jeden geradzahligen Kurs überspannt, bezieht sich darauf, wo viele Händler ihre Stops platzieren und kann daher eine Risikozone sein, die Sie bei der Platzierung Ihrer Stops meiden sollten. Die Zone fungiert
FREE

Heiken Ashi-Schaltfläche Heiken-Ashi , oft auch Heikin-Ashi geschrieben, ist ein japanisches Wort und bedeutet "Durchschnittsbalken". Der Heiken-Ashi-Ansatz kann in Verbindung mit Candlestick-Charts verwendet werden, um Markttrends zu erkennen und künftige Kurse vorherzusagen. Er ist nützlich, um Candlestick-Charts leichter lesbar zu machen und Muster zu analysieren. Mit Hilfe von Heiken-Ashi-Diagrammen können Händler bestimmen, wann sie bei einem anhaltenden Trend im Handel bleiben und bei ein
FREE

Fibomathe-Indikator: Unterstützungs- und Widerstandswerkzeug für MT4 Der Fibomathe-Indikator ist ein technisches Analysewerkzeug für MetaTrader 4 (MT4), das Händler bei der Identifizierung von Unterstützungs- und Widerstandsniveaus, Take-Profit-Zonen und zusätzlichen Preisprojektionsbereichen unterstützt. Er eignet sich für Händler, die strukturierte Ansätze zur Analyse von Kursbewegungen und zum Management von Trades verwenden. Hauptmerkmale Unterstützungs- und Widerstandsniveaus:
Ermöglicht e
FREE

Der Indikator zeichnet zwei Kanallinien : Oberes Band (rot) - obere Begrenzung, Unteres Band (blau) - die untere Begrenzung, Der Kanal wird auf der Grundlage des zentrierten TMA (Triangular Moving Average) berechnet und wird durch die aktuelle Volatilität über ATR × Multiplikator erweitert/verengt. Dadurch passt sich der Indikator automatisch an den Markt an: in ruhigen Phasen verengt sich der Kanal, in impulsiven Phasen weitet er sich. Hauptmerkmale Bildet oberen und unteren Volatilitätska
FREE
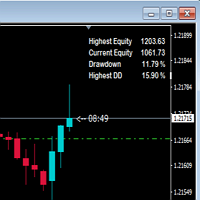
Dieser Indikator zeigt den Drawdown basierend auf dem höchsten Eigenkapital an. Normalerweise wird der Drawdown verwendet, um die Leistung eines Handelskontos zu zeigen, insbesondere wenn jemand an einem Handelswettbewerb teilnimmt. Wenn der Drawdown eine bestimmte Zahl überschreitet, wird das Wettbewerbskonto disqualifiziert. Ich hoffe also, dass dieser Indikator uns warnt, den Drawdown beizubehalten und das Konto trotzdem zu retten.
FREE

ATSCStrategy ist ein vielseitiger Indikator, der sowohl für binäre Optionen als auch für Devisenmärkte entwickelt wurde. Nutzen Sie dieses dynamische Tool für Ihre Handelsstrategien und gewinnen Sie wertvolle Erkenntnisse, um in der schnelllebigen Welt der binären Optionen und des Devisenhandels fundierte Entscheidungen zu treffen.
-Forex Market
-Binary Option Market
-Binary use timeframe 1M - 5M
-Forex use timeframe M30 or high
FREE

Mein Fibonacci Ein automatisierter Fibonacci-Indikator, der die Erkennung von ZigZag-Schwüngen mit einer umfassenden Expert Advisor-Integration durch ein 20-Buffer-System kombiniert. More details about data specification and EA integration: https://www.mql5.com/en/blogs/post/764109 Kernfunktionen Automatisierte Fibonacci-Erkennung Der Indikator identifiziert Swing-Punkte anhand konfigurierbarer ZigZag-Parameter und zeichnet automatisch Fibonacci-Retracements und -Extensions. Er aktualisiert die
FREE

Sind Sie es leid, viele offene Charts zu haben und viele verschiedene Währungspaare zu beobachten? MCTSI überwacht die Stärken von 56 Währungspaaren und zeigt Ihnen die besten Paare für den Handel. Sie müssen nicht mehr raten, welche Währung stärker/schwächer ist, und nicht mehr mit einem Paar handeln, das sich nicht positiv entwickelt. Dies ist die BASIC-Version. MCTSIP ist die fortgeschrittenere Version und kann hier gefunden werden: https://www.mql5.com/en/market/product/20994 Wenn Sie viele
FREE
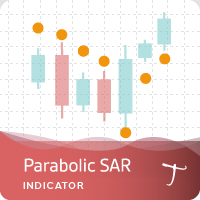
Tipu Parabolic SAR Panel ist die modifizierte Version des ursprünglichen Parabolic SAR-Indikators, der von MetaQuotes hier veröffentlicht wurde. Die Dashboard Panel (Multi-Symbol) Version für diesen Indikator ist hier verfügbar.
Merkmale Ein einfach zu bedienendes Panel, das den Parabolic SAR-Trend und die Signale des ausgewählten Zeitrahmens anzeigt. Anpassbare Kauf-/Verkaufswarnungen, Push-Warnungen, E-Mail-Warnungen oder visuelle Warnungen auf dem Bildschirm. Anpassbares Panel. Das Panel kan
FREE
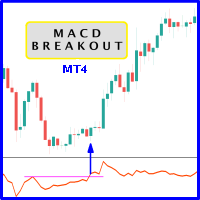
Es besteht die Wahrscheinlichkeit, dass höhere Kurse verzeichnet werden , wenn der MACD aus dem historischen Widerstandsniveau des Oszillators ausbricht. Es wird dringend empfohlen, Kursausbrüche mit Oszillatorausbrüchen zu bestätigen, da sie vergleichbare Auswirkungen haben wie das Durchbrechen von Unterstützungs- und Widerstandsniveaus durch den Kurs; sicherlich werden Short-Trades die gleiche Wahrnehmung haben. Der Vorteil ist, dass der Oszillatorausbruch oft dem Preisausbruch vorausgeht und
FREE

Wie der exponentielle gleitende Durchschnitt (EMA) reagiert er stärker auf alle Preisschwankungen als der einfache gleitende Durchschnitt (SMA), so dass der DEMA Händlern helfen kann, Umkehrungen früher zu erkennen, da er schneller auf Veränderungen der Marktaktivität reagiert. Der DEMA wurde von Patrick Mulloy in dem Bestreben entwickelt, die Verzögerungszeit der traditionellen MAs zu verringern. ( TASC_Feb. 1994 ). Der DEMA kann auch als Komponente in vielen Indikatoren wie dem Moving Average
FREE
Dieser Indikator ist die mql-Version des Indikators Linear Regression Candles . Find out more here: https://www.mql5.com/en/users/rashedsamir/seller Es gibt viele lineare Regressionsindikatoren, die meisten von ihnen zeichnen Linien oder Kanäle, aber dieser Indikator zeichnet tatsächlich ein Diagramm Dieses Skript enthält Funktionen wie lineare Regression für Eröffnungs-, Hoch-, Tief- und Schlusskurse, Signalglättung mit einfachen oder exponentiellen gleitenden Durchschnitten. Ich freue mich üb
FREE

Sind Sie es leid, Fibonacci-Retracements oder -Extensions manuell darzustellen? Dieser Indikator zeigt automatisch Fibonacci-Retracements oder -Extensions an, die von zwei verschiedenen Preispunkten aus berechnet werden, ohne dass ein menschliches Eingreifen oder eine manuelle Objektverankerung erforderlich ist. [ Installationsanleitung | Update-Anleitung | Fehlerbehebung | FAQ | Alle Produkte ] Einfach zu benutzen Manuelle Verankerung ist nicht erforderlich Perfekt für Preiskonvergenzstudien De
FREE

Der Algorithmus basiert auf der Idee des Currency Power Meter-Indikators. In dieser Version ist die Anzahl der angezeigten Werte unbegrenzt, der Code ist kompakter und schneller, Werte des aktuellen Balkens können über Indikatorpuffer abgerufen werden. Was der Indikator zeigt : Ein dünnes Band und die obere Zahl vor der Währung zeigen den relativen Stärkeindex für die letzten N Stunden (N wird in den Parametern in der Variablen 'Stunden' eingestellt), ein breiteres Band zeigt den Tagesindex an
FREE

QualifiedEngulfing - ist die kostenlose Version des ProEngulfing -Indikators. ProEngulfing - ist die kostenpflichtige Version des Advance Engulf-Indikators. Laden Sie ihn hier herunter. Was ist der Unterschied zwischen der kostenlosen und der kostenpflichtigen Version von ProEngulfing ? Die kostenlose Version hat die Einschränkung von einem Signal pro Tag. Vorstellung von QualifiedEngulfing - Ihr professioneller Engulf-Muster-Indikator für MT4 Entfesseln Sie die Kraft der Präzision mit Qualifie
FREE

!!!Die kostenlose Version funktioniert nur auf "EURUSD"!!! WaPreviousCandleLevels MT4 zeigt die vorherige Kerze Ebenen, es zeigt die vorherige Kerze Open High Low Close Ebenen (OHLC Levels) in verschiedenen Zeitrahmen. Es wurde entwickelt, um dem Händler zu helfen, den Markt zu analysieren und die Aufmerksamkeit auf die vorherigen Kerzenlevel in verschiedenen Zeitrahmen zu richten. Wir alle wissen, dass die OHLC-Levels auf Monats-, Wochen- und Tagesbasis sehr stark sind und dass der Preis in de
FREE

Eine fraktale Divergenz ist eine versteckte Divergenz , die auf den Fraktalen von Bill Williams basiert. Eine fraktale Aufwärtsdivergenz ist eine Kombination aus zwei unteren Fraktalen, von denen das letzte unter dem vorhergehenden liegt und gleichzeitig zwei Kerzen rechts vom Tief des letzten Fraktals Tiefstwerte aufweisen, die über dem vorhergehenden Fraktal liegen (siehe Screenshot 1). Eine bärische fraktale Divergenz ist eine Kombination aus zwei benachbarten oberen Fraktalen, wobei das letz
FREE

Der BinaryFortune-Indikator wurde speziell für den Handel mit kurzfristigen binären Optionen entwickelt und angepasst. Der Algorithmus des Indikators analysiert zahlreiche Faktoren, bevor er ein Signal erzeugt. Der Indikator wird auf herkömmliche Weise installiert. Der Indikator besteht aus einem Informationsfenster, in dem der Name des Handelsinstruments, die Unterstützungs- und Widerstandsniveaus sowie das Signal selbst (KAUFEN , VERKAUFEN oder WARTEN ) angezeigt werden. Ein Signal wird von ei
FREE

Informativer & optimierter Zickzackkurs, kumuliertes Volumen, Preisänderung Eine Neufassung des traditionellen Zickzack-Tools mit neuen Zusätzen. Eigenschaften:- Optimierter Code Anzeige des kumulierten Volumens zwischen den Spitzenwerten Zeigt die Preisveränderung zwischen den Spitzenwerten an Verwendung:- Erkennen von Trendschwankungen Identifizierung von Schwankungen mit hohem Volumen Vergleichen von Preisänderungen zwischen Schwankungen Zeichnen des Fibonacci-Tools bei starken Preisänderunge
FREE
ALGO BOX - Fortgeschrittenes Day-Trading-System ALGO BOX ist ein leistungsstarker Daytrading-Indikator, der für ernsthafte Trader entwickelt wurde, die Präzision und Zuverlässigkeit beim Ausbruchshandel verlangen. Durch die Kombination von fortschrittlicher Preisaktionsanalyse mit Echtzeitdaten hilft er Ihnen, Geschäfte mit hoher Wahrscheinlichkeit zu erkennen und gleichzeitig das Risiko unter Kontrolle zu halten. Warum ALGO BOX sich abhebt Identifizieren Sie klare, profitable Ausbruchsmöglichke
FREE

Hallo zusammen. Ich biete für die Überprüfung einer sehr anständigen Indikator Eingänge sind sehr klar sein kann martin Arbeit aus 30 min vor und nach den Nachrichten nicht handeln kann geworfen werden News-Indikator mehr Sie brauchen nichts anderes haben Sie ein Signal Pfeil für befestigt auf den nächsten Eintrag Ablauf jeder Währung ist auch jeder. Oszillatoren und Algorithmus des Autors.Und auch ist es möglich, durch den Bot Auto-Trading auf dem Bildschirm.Und Freunde nach dem Kauf oder Miete
FREE

Dieser Indikator identifiziert automatisch wichtige Unterstützungs- und Widerstandsniveaus durch die Analyse von Volumenmustern. Im Gegensatz zu traditionellen S/R-Tools, die sich nur auf den Preis verlassen, findet Volume S/R Niveaus, auf denen der Markt wirklich reagiert hat. ERKENNUNGSLOGIK : - Zonen mit hohem Volumen: Preisniveaus, auf denen starke Käufe/Verkäufe stattfanden - Zonen mit geringem Volumen: Bereiche von schwachem Interesse - potenzielle Ausbruchs- oder Umkehrzonen
INTELLIGENT
FREE

Wir von Stonehill Forex veröffentlichen unseren ersten selbst entwickelten Indikator, der im März 2025 auf der Stonehill Forex-Website vorgestellt wurde. Die ursprüngliche Version wurde für MetaTrader 4 (MT4) und später aufgrund des Community-Interesses für MT5 und TradingView entwickelt. Dieser Indikator ist kostenlos erhältlich und bildet den Grundstein unserer Bibliothek.
Es handelt sich um ein zweizeiliges Cross-Price-Overlay, das im Kern zwei gewichtete gleitende Durchschnittslinien verwe
FREE
Der MetaTrader Market ist eine einzigartige Plattform für den Verkauf von Robotern und technischen Indikatoren.
Das Merkblatt für Nutzer der MQL5.community informiert Sie über weitere Möglichkeiten: nur bei uns können Trader Handelssignale kopieren, Programme bei Freiberuflern bestellen, Zahlungen über das Handelssystem automatisch tätigen sowie das MQL5 Cloud Network nutzen.
Sie verpassen Handelsmöglichkeiten:
- Freie Handelsapplikationen
- Über 8.000 Signale zum Kopieren
- Wirtschaftsnachrichten für die Lage an den Finanzmärkte
Registrierung
Einloggen
Wenn Sie kein Benutzerkonto haben, registrieren Sie sich
Erlauben Sie die Verwendung von Cookies, um sich auf der Website MQL5.com anzumelden.
Bitte aktivieren Sie die notwendige Einstellung in Ihrem Browser, da Sie sich sonst nicht einloggen können.