Konstenfreie technische Indikatoren für den MetaTrader 4 - 5
Dieser Indikator ist einzigartig in seiner Art, er eignet sich hervorragend für Scalping auf XAUUSD und auch für den Handel auf höheren Zeitskalen!
. Die Benachrichtigung informiert Sie über die wichtigsten Einstiegspunkte, so dass Sie auf den Trend hin handeln sollten. Ideal für Scalping! The Best Trend Signals ist ein Trendindikator für mehrere Währungen, der für alle Finanzinstrumente, Währungen, Kryptowährungen, Metalle, Aktien und Indizes verwendet werden kann. Empfohlener Zeitrahmen M15,
FREE

Dieser Indikator findet Three-Drives-Muster. Das Three-Drives-Muster ist ein 6-Punkte-Umkehrmuster, das durch eine Reihe höherer Hochs oder tieferer Tiefs gekennzeichnet ist, die an einer 127%- oder 161,8%-Fibonacci-Erweiterung enden. Es signalisiert, dass der Markt erschöpft ist und ein Umschwung stattfinden kann. [ Installationsanleitung | Update-Anleitung | Fehlerbehebung | FAQ | Alle Produkte ] Anpassbare Mustergrößen
Anpassbare Farben und Größen
Anpassbare Ausbruchsperioden Anpassbare 1-2-3
FREE

Zig Zag 123 sagt uns, wann eine Umkehr oder Fortsetzung wahrscheinlicher ist, indem wir die Verschiebung von Angebot und Nachfrage betrachten. Wenn dies geschieht, erscheint ein charakteristisches Muster, das als 123 (auch als ABC bekannt) bekannt ist, und bricht oft in Richtung eines höheren Tiefs oder eines niedrigeren Hochs aus.
Es wurden Stop-Loss- und Take-Profit-Levels hinzugefügt. Es gibt ein Panel, das die Gesamtperformance Ihrer Trades anzeigt, wenn Sie diese Stop-Loss- und Take-Profi
FREE
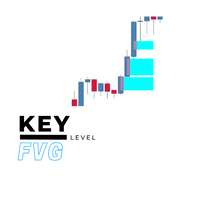
Schlüssel-Level FVG Sind Sie es leid, Ihre Charts manuell nach Fair Value Gaps (FVGs) zu durchsuchen? Der Key Level FVG ist ein leistungsstarkes und benutzerfreundliches Tool, das diese kritischen Preisungleichgewichte automatisch für Sie erkennt und anzeigt. Dieser Indikator basiert auf bekannten Smart-Money-Konzepten und hebt Bereiche mit hoher Wahrscheinlichkeit hervor, in die der Kurs zurückkehren wird, so dass Sie klare und umsetzbare Handelszonen erhalten. Ganz gleich, ob Sie ein erfahrene
FREE

Der Indikator eines professionellen Traders ist ein Pfeilindikator zur Vorhersage der Richtung der Kursbewegung. Ich habe seit 2014 an diesem Indikator gearbeitet.
Sie können diesen Indikator als Ihren Hauptindikator verwenden, seine Einstiegssignale nutzen und ihn als einzigen Indikator verwenden, um Einstiegspunkte zu finden.
Über das Produkt: Empfohlener TF [H4-D1-W1] . Der Indikator sagt die Richtung der nächsten Kerze voraus. Passt zu einer Vielzahl von Instrumenten; Flexibilität bei den
FREE

Sind Sie bereit, der Sherlock Holmes des Forex-Handels zu werden? ️️ Wir präsentieren das ultimative Trading-Toolkit: Den Lisek Levels and Channels Indikator!!! Vergessen Sie das Jonglieren mit mehreren Indikatoren wie in einer Zirkusnummer. Wir haben alles, was Sie brauchen, in eine spektakuläre Show gepackt: Preisniveaus? Check! Preiskanäle? Wetten! Preis-VWAP? Oh ja! On-Balance-Volumen? Alles da! Und das Sahnehäubchen obendrauf? Alarme und Push-Benachrichtigungen, die Sie schne
FREE
ALL MOVING AVERAGES: Der ultimative benutzerdefinierte Indikator für vielfältige Strategien Der benutzerdefinierte Indikator ALL MOVING AVERAGES ist Ihr unverzichtbares Werkzeug für eine umfassende technische Analyse, mit einer beeindruckenden Sammlung von über 31 der beliebtesten gleitenden Durchschnitte . Dieser Indikator wurde sowohl für erfahrene Trader als auch für Anfänger entwickelt und bietet eine unvergleichliche Flexibilität, die es Ihnen ermöglicht, Ihre gleitenden Durchschnitte perfe
FREE
Einstiegs- und Ausstiegszeitpunkt mit Average True Range (ATR) Trailing Stops ATR Trailing Stops werden in erster Linie zum Schutz des Kapitals und zur Sicherung von Gewinnen bei einzelnen Trades eingesetzt, können aber auch in Verbindung mit einem Trendfilter verwendet werden, um Einstiegssignale zu geben. Der Indikator erleichtert Ihnen die Berechnung des Stop-Loss, da er Sie visuell bei der Auswahl des Stop-Loss-Niveaus auf dem Chart unterstützt, indem er den aktuellen Wert des ATR-Indikators
FREE

Candle Color Day – Farbindikator für Candlesticks je nach Wochentag
Was ist das? Ein einfaches visuelles Hilfsmittel, das Candlesticks in einem Chart je nach Wochentag farblich darstellt. Montag hat eine Farbe, Dienstag eine andere usw. Haben Sie sich jemals gefragt, wie häufig sich Kurse an bestimmten Wochentagen auf eine bestimmte Weise verhalten? Dieser Indikator hilft Ihnen, solche Muster zu erkennen.
Für wen ist er geeignet? Für Trader, die:
den Wochentag anhand historischer Daten schne
FREE

Der Indikator analysiert die angegebene Anzahl von Kerzen und zeichnet Fibonacci-Niveaus basierend auf dem Hoch-Tief. Da sich die Ebenen neu anordnen, interessieren wir uns für die rechte Seite des Bereichs. Der Preis magnetisiert die Niveaus und reagiert auf die Berührung. Verwenden Sie dieses Tool, um nach einer Korrektur einen Trendeintrittspunkt zu finden. Wenn wir links sehen, dass die Pegel perfekt angestiegen sind, können wir davon ausgehen, dass wir das Ende der Bewegung am Extrempunkt g
FREE
Der Flower-Indikator ist ein technisches Analysetool, das hauptsächlich zur Trenderkennung und zur Unterstützung von Scalping- oder Intraday-Handelsstrategien eingesetzt wird.
Der Flower-Indikator ist ein Signaltrendindikator, der auf technischen Analysen und Preisdynamikanalysen basiert. Er visualisiert Trends mithilfe farbiger Blumen – blaue Blumen signalisieren einen Aufwärtstrend, rote Blumen einen Abwärtstrend.
Jedes Level kann als Unterstützung und Widerstand fungieren (achten Sie auf +
FREE

Auto-Fibonacci-Retracement-Indikator - Flexibel und verlässlich Dies ist nicht nur ein weiterer Auto Fibonacci Retracement Indikator - es ist eines der flexibelsten und zuverlässigsten Tools, die es gibt . Wenn Sie ihn nützlich finden, hinterlassen Sie bitte eine Bewertung oder einen Kommentar, um das Projekt zu unterstützen. Sehen Sie sich meine anderen hilfreichen Tools unten an: Timeframes Trend Scanner - Scannen Sie den Trend von Vermögenswerten in verschiedenen Zeitrahmen mit mehreren Indi
FREE

MACD-Divergenz Einfache Ausgabe Die ursprüngliche MACD-Berechnung, aktualisiert, um eine doppelte Linie MACD, so dass das Urteil ist intuitiver und mehr im Einklang mit dem Großteil der Handelsplattform der Forschung Gewohnheiten, sondern auch automatisch markieren die Divergenz der soliden Linie, müssen nicht von 0 zu lernen, zu bohren beginnen.
Zur gleichen Zeit, biete ich auch eine Erinnerung Service, wenn Sie mit Hausarbeit beschäftigt sind nicht die Zeit haben, nur auf die Audio-, einmal
FREE

Der Supreme HmaSignal-Indikator ist ein Indikator für den Trendhandel, sein Hauptmerkmal ist der Rumpf gleitenden Durchschnitt farbige Linie, und sekundär ist kaufen und verkaufen Pfeile, Pfeile sind fair, aber der Schwerpunkt liegt auf der farbigen hma, dieser Indikator nicht neu malen oder zurück malen oder verzögern ihre Signale. Wenn Ihnen dieser Indikator gefällt, schauen Sie sich bitte meinen Supreme Trendhisto: hier , und meinen Supreme Diamond Indikator: hier an
Parameter: HMA-Periode H
FREE

Dominion-Levels: Der Architekt der "Marktstruktur"
Perfekt für Gold (XAUUSD)
Das definitive Werkzeug zur Identifizierung von "harten" Unterstützungs- und Widerstandsniveaus, die tatsächlich halten. Die meisten Händler ziehen Unterstützungs- und Widerstandslinien auf der Grundlage von Gefühlen oder vagen Zonen. Das Ergebnis? Unübersichtliche Charts, subjektive Entscheidungen und Ausstiegsmöglichkeiten durch "Lärm". Dominion Levels löst dieses Problem, indem es die Subjektivität beseitigt. Es ha
FREE

Ichimoku Trend Alert ist der Ichimoku Kinko Hyo Indikator mit Alerts und Signalfiltern.
Ichimoku Trend Alert Funktionen: Optionale Überprüfung von Ichimoku-Wolke, Tenkan sen (Umkehrlinie), Kijun sen (Basislinie), Senkou-Spanne A, Senkou-Spanne B und Chikou-Spanne relativ zum Preis und mehr. Popup-, E-Mail- und Telefon-Benachrichtigungen für ausgewählte Symbole und Zeitrahmen.
Es gibt 9 klassische Ichimoku-Trendfilter, die Sie in den Einstellungen aktivieren/deaktivieren können: Preis/Wolkenauf
FREE
Renko Chart mit gleitendem Durchschnitt. Klassische Renko-Chart-Idee. Es wird auf dem Hauptdiagramm dargestellt und der Gleitende Durchschnitt kann angewendet werden. Die Preise für die Balken werden von einem niedrigeren Zeitrahmen verwendet. Parameter: BarsBack - wie viele Bars des unteren Zeitrahmens verwendet werden sollen. Wenn der Wert Null ist, werden alle verfügbaren Balken verwendet. LTF - unterer Zeitrahmen. BrickSize - Renko-Balken in Punkten. BullishColor - Farbe für die Bullenkerze
FREE

Dies ist ein Signal-Dashboard, das auf SMA und WMA basiert. Bullen- und Bärensignale weisen darauf hin, dass der Kurs wahrscheinlich seine Richtung geändert hat (nicht nur eine vorübergehende Korrektur). Trap-Signale deuten darauf hin, dass sich der Kurs wahrscheinlich nur in einer Korrektur befindet, so dass Sie sich nicht beeilen sollten, eine entgegengesetzte Position einzunehmen. Für eine effektive Nutzung sollten Sie sich nur auf die Spalte des Zeitrahmens konzentrieren, in dem Sie handeln.
FREE

Der Indikator " Trade by Levels " wurde entwickelt, um automatisch die Bildung eines Modells für den Einstieg in den Markt auf dem Chart des ausgewählten Instruments zu bestimmen.
Definitionen : ⦁ BFl ist der Balken, der das Niveau gebildet hat. ⦁ BCL1 und BCL2 Balken, die das Niveau bestätigen.
Das grafische Modell: ⦁ Niveaus hoch\low die Balken BFL und BCL1 müssen die Genauigkeit auf den Punkt bringen ⦁ es können beliebig viele Balken zwischen BFL und BCL1 liegen. ⦁ zwischen BCL1 und BCL2 s
FREE

Beschreibung: Dieser Indikator zeichnet die ZigZag-Linie in mehreren Zeitrahmen und sucht auch nach harmonischen Mustern vor der Fertigstellung des Musters.
Merkmale: Fünf Instanzen des ZigZag-Indikators können für jeden gewünschten Zeitrahmen und Input konfiguriert werden. Zeichnen Sie Harmonic-Muster vor dem Abschluss des Musters. Anzeige der Fibonacci-Retracement-Verhältnisse. Konfigurierbare Fibonacci-Retracement-Ratios. Zeichnen Sie AB=CD basierend auf dem von Ihnen definierten Fibonacci
FREE

Das Matrix Arrow Indicator Multi Timeframe Panel MT4 ist ein kostenloses Add-On und eine großartige Bereicherung für Ihren Matrix Arrow Indicator MT4 . Es zeigt das aktuelle Matrix Arrow Indicator MT4 -Signal für 5 benutzerdefinierte Zeitrahmen und für insgesamt 16 veränderbare Symbole/Instrumente. Der Benutzer hat die Möglichkeit, jeden der 10 Standardindikatoren, aus denen der Matrix Arrow Indicator MT4 besteht, zu aktivieren/deaktivieren. Alle der 10 Standardindikatorattribute sind ebenfalls
FREE

Der Keltner-Kanal ist ein bekannter Indikator, der nicht in der Standard-Indikatorenliste von MT4 enthalten ist (Sie können ihn irgendwie von Ihrem Broker erhalten). Dieser Indikator hilft Ihnen, den Trend und manchmal überkaufte/überverkaufte Preise während eines flachen Trends zu definieren. Eingabe Beschreibung: EMA-Periode: Periode des gleitenden Durchschnitts, die für den Indikator verwendet wird. Muss größer als 1 sein. ATR-Zeitraum: Für den Indikator verwendete Average True Range-Periode.
FREE
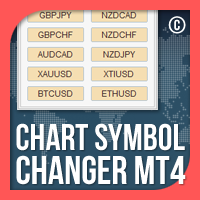
Chart Symbol Changer für MT4 ist ein Indikator/Dienstprogramm, das Ihnen die Möglichkeit bietet, das aktuelle Chartsymbol, das mit einem Klick auf eine Symbolschaltfläche auf seinem Panel verbunden ist, zu ändern. Chart Symbol Changer für MT4 bietet Ihnen die Möglichkeit, die 32 Symboltasten nach Ihren persönlichen Vorlieben zu konfigurieren, indem Sie die Paare hinzufügen, die Sie im Auge behalten und am häufigsten handeln möchten. Auf diese Weise verpassen Sie keine Gelegenheit, denn mit weni
FREE
Der IT Trend Colored Indikator ist ein leistungsfähiges Werkzeug, das von IT Trading (InfiniteTrades Software Corp) entwickelt wurde, um Händler bei der visuellen und effektiven Identifizierung von Markttrends zu unterstützen. Diese Version ist ein benutzerdefinierter Indikator für die Handelsplattform MetaTrader 4.
Hauptmerkmale :
- Trend-Identifikation: Der Indikator verwendet eine Kombination aus einfachen gleitenden Durchschnitten (SMA), um die Richtung des Markttrends zu bestimmen.
- In
FREE

Dieses Dashboard kann kostenlos heruntergeladen werden, setzt aber voraus, dass Sie den Gold Pro MT4-Indikator besitzen . Holen Sie sich den Indikator hier: https: //www.mql5.com/en/market/product/60430
Das Dashboard zeigt Ihnen auf einem einzigen Chart alle Zeitrahmen (M1 bis Monthly) mit ihrem eigenen Status für den Indikator :Gold Pro MT4
alle Zeitrahmen und alle Symbole: intelligenter Algorithmus erkennt den Trend, filtert das Marktrauschen heraus und gibt Einstiegssignale!!!
Wie man de
FREE

RT_TrendlineTool : Semi-AutoTrendline Tool auf MT4 2 einfache Schritte, drücken Sie einfach die Taste [T] auf Ihrer Tastatur und klicken Sie auf den Swing High/Low, der Sie interessiert.
Dann wird der Indikator versuchen, eine Trendlinie zu zeichnen, die nur durch den Docht verläuft, nicht durch den Körper der Kerze
und versuchen, den Swing-Punkt so weit wie möglich mit der geringsten Neigung der Trendlinie zu kreuzen. Sie können bis zu 10 Trendlinien zeichnen.
Sie können eine Warnung erhalten,
FREE
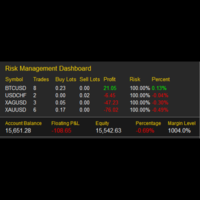
Mein Risikomanagement Das Risikomanagement-Dashboard ist ein visuelles Instrument, das den Händlern hilft, das Risiko in Echtzeit zu überwachen. Mit seinem klaren und kompakten Layout bietet es einen sofortigen Überblick über die Handelsaktivitäten und ermöglicht eine diszipliniertere und fundiertere Entscheidungsfindung. Hauptmerkmale Zusammenfassung aktiver Symbole
Zeigt alle gehandelten Symbole mit der Anzahl der Trades, den gesamten Kauf-/Verkaufs-Lots und dem aktuellen Gewinn/Verlust an. R
FREE

Volatilitätskanal-Indikator Reiten Sie die Wellen der Marktvolatilität mit Präzision ... bitte hinterlassen Sie eine 5-Sterne-Bewertung, wenn Sie dieses Produkt lieben Der Indikator ist kostenlos. Der Quellcode ist für nur 30usd erhältlich.
Sind Sie es leid, zu früh oder zu spät in den Handel einzusteigen? Verpassen Sie Ausbrüche? Sich in falschen Signalen zu verfangen? Der Volatilitätskanal-Indikator verwandelt chaotische Kursbewegungen in kristallklare Handelsmöglichkeiten. Was Si
FREE
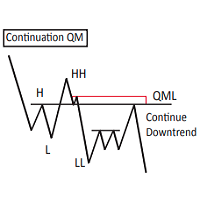
Dieses Custom Mapping Tool ist ein innovativer MT4-Indikator, der das Markieren und Kartieren von Charts vereinfacht. Mit diesem Tool müssen Sie keine Zeit mehr damit verschwenden, sich wiederholende Wörter, Rechtecke und Trendlinienfarben jedes Mal neu zu schreiben. Neue Funktion V5.60:
Pfad zeichnen - Wie der TV-Pfad-Zeichenmodus, der für den nackten Chart-Händler sehr nützlich ist. Sie können Zickzack zeichnen, zeichnen Sie Ihre Muster manuell. Ändern Sie den Stil in den Indikatoreinstellunge
FREE
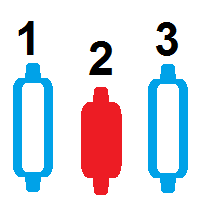
Candlestick-Zähler dieser Indikator zählt Kerzen, die sich auf dem Chart eines beliebigen Zeitrahmens befinden eine kostenlose Bartheke, die Sie auf mt4 herunterladen können der Candlestick-Zähler zählt, wie viele Kerzen sich in einem größeren Chart befinden mit diesem Kerzenzähler können Sie die automatische Kerzenzählung durchführen kostenloser Candlestick-Zählindikator zum automatischen Herunterladen und Zählen von Balken bar counter to count the bars count candle counter indicator mt4 count
FREE
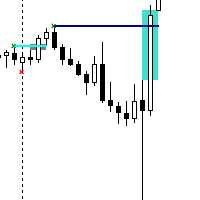
Der Kontraktions-/Expansions-Breakout-Indikator für MetaTrader 4 (MT4) ist ein leistungsstarkes Tool, das den Ausbruch von bullischen und bearischen Kontraktions- oder Expansionsformationen auf den Finanzmärkten erkennt und signalisiert. Mithilfe fortschrittlicher algorithmischer Berechnungen unterstützt dieser Indikator Händler bei der Erkennung signifikanter Kursbewegungen, die häufig mit diesen Formationen einhergehen, und liefert wertvolle Erkenntnisse für strategische Handelsentscheidungen.
FREE

Gold TL MTF - Dies ist ein feiner technischer Indikator für Aktien. Der Algorithmus des Indikators analysiert die Bewegung des Vermögenspreises und spiegelt Trendlinien entlang der Fraktale eines bestimmten Zeitrahmens (TF) wider.
Vorteile des Indikators: Der Indikator erzeugt Signale mit hoher Genauigkeit. Das bestätigte Signal des Indikators verschwindet nicht und wird nicht neu gezeichnet. Sie können auf der MetaTrader 4 Handelsplattform eines beliebigen Brokers handeln. Sie können mit belie
FREE

Tritt dem Koala Trading Solution-Kanal in der MQL5-Community bei, um die neuesten Signale und Nachrichten zu allen Koala-Produkten zu erfahren. Der Beitrittslink befindet sich unten: https://www.mql5.com/en/channels/koalatradingsolution Beschreibung :
Wir freuen uns, Ihnen unseren neuen kostenlosen Indikator vorzustellen, der auf einem der professionellen und beliebten Indikatoren auf dem Devisenmarkt (Parabolic SAR) basiert. Dieser Indikator ist eine neue Modifikation des ursprünglichen Pa
FREE

MTF-WPR-Screener Ein kompaktes Multi-Timeframe-Dashboard, das das Williams' %R (WPR) in ein klares, umsetzbares Signal umwandelt: JETZT: KAUFEN/VERKAUFEN mit Konfidenzprozent , plus dem Vorschlag für den besten Einstiegszeitpunkt und einer einfachen Volatilitätskennzeichnung . Was Sie erhalten JETZT-Entscheidung (jede Sekunde): KAUFEN/VERKAUFEN + Vertrauen % Best Entry TF: hebt den am besten geeigneten Zeitrahmen für den Einstieg in die aktuelle Richtung hervor MTF-Tabelle (optional): WPR-Werte
FREE
Heikin Ashi Binary – Visueller Trendunterstützungsindikator mit binärer Anzeige Übersicht Heikin Ashi Binary ist ein Indikator für MetaTrader, der Trendinformationen von Heikin Ashi in binärem Format (zweifarbige Blöcke) in einem Unterfenster anzeigt.
Anstelle traditioneller Kerzen stellt der Indikator Aufwärts- (bullisch) und Abwärtstrends (bärisch) als einfache farbige Blöcke dar.
Dies ermöglicht eine schnelle Erkennung von Trendfortsetzungen oder möglichen Umkehrpunkten. Der Indikator eignet
FREE

Dieser Indikator ist ein professioneller Trend-Identifikator, er misst den Winkel oder die Neigung der gleitenden Durchschnitte mit verschiedenen Methoden. Da dieser Indikator Winkel berechnet, können Sie die Stärke des Trends anhand der Größe des Winkels erkennen. Er zeigt auch an, ob der Winkel zunimmt oder abnimmt, was Ihnen die Möglichkeit gibt, mehr Informationen über den aktuellen Trend zu erhalten. Sie können diesen Indikator mit Ihrer Strategie als Filter kombinieren oder ihn allein verw
FREE

Info Plus ist ein einfaches Tool, das den aktuellen Status einer Anlageklasse anzeigt. Zu den von Info Plus angezeigten Informationen gehören: Geldkurs Höchst- und Tiefstkurs des Tages. Verbleibende Zeit der Kerze. Aktueller Spread. Ausgewählter Zeitrahmen. Ausgewählte Anlageklasse (Symbol). Pip-Wert. Offene Positionen. Gebuchte Pips insgesamt. Pips pro Handel. Sitzungszeiten (sie sind möglicherweise nicht genau und können sich ändern). Datum und Uhrzeit.
Wie funktioniert es? Wenn Info Plus auf
FREE

Übersicht Happy Cub Junior ist ein analytisches Dashboard für mehrere Zeitrahmen und Indikatoren. Es konsolidiert Daten von 10 verschiedenen technischen Indikatoren über 8 Zeitrahmen in einer einzigen, farbkodierten Tabelle. Sein Hauptzweck ist es, Händlern zu helfen, "Konfluenz" zu identifizieren - der seltene Moment, wenn mehrere Indikatoren und Zeitrahmen in die gleiche Richtung ausgerichtet sind. Die kostenpflichtige Version von Happy Cub "https://www.mql5.com/en/market/product/165154" hat e
FREE
Produkttitel ZigZag Colored (MT4)
See also >> Smart ZigZag Pro , Smart ZigZag (free)
Kurzbeschreibung Zwei‑farbiger ZigZag für MT4, der die Ein‑Farben‑Beschränkung einer Linie löst und EA‑fähige Puffer mit Wert und Richtung des aktuellen Legs je Kerze bereitstellt. Überblick Stellt den klassischen ZigZag als zwei getrennte, farbcodierte Linien dar; Werte pro Kerze verfügbar für EAs/Indikatoren. Hauptfunktionen Zwei‑farbige Legs; EA‑Puffer ZigZag Up , ZigZag Down , ZigZag Per Bar ; native
FREE

Dies ist ein kostenloses Produkt, das Sie gerne für Ihre Zwecke verwenden können!
Ich würde mich sehr über eine positive 5-Sterne-Bewertung freuen! Vielen Dank!
Klicken Sie hier, um hochwertige Trading-Roboter und Indikatoren zu sehen!
Forex Indicator Spread Display für MT4, großartiges zusätzliches Handelstool.
- Der Spread Display-Indikator zeigt den aktuellen Spread des Forex-Paares an, an dem es angebracht ist. - Es ist möglich, den Spread-Anzeigewert in jeder Ecke des Diagramms zu plat
FREE

Backtest mit guten Trenderkennungsergebnissen ab Januar 2023
EURUSD Zeitrahmen: m15, m30, H1
AUDUSD Zeitrahmen: m15, m30 NASDAQ Zeitrahmen: m15 S&P 500 Zeitrahmen: m15, m30 XAUUSD Zeitrahmen: m30 BTCUSD Zeitlicher Rahmen: H4
Dies sind nur einige der getesteten Vermögenswerte (Bitte beachten Sie, dass vergangene Ergebnisse keine Garantie für zukünftige Ergebnisse sind). Beachten Sie, dass es sich hierbei nicht um eine vollständige Strategie handelt. Sie können diesen Indikator als Einstiegsau
FREE

Necessary for traders: tools and indicators Waves automatically calculate indicators, channel trend trading Perfect trend-wave automatic calculation channel calculation , MT4 Perfect trend-wave automatic calculation channel calculation , MT5 Local Trading copying Easy And Fast Copy , MT4 Easy And Fast Copy , MT5 Local Trading copying For DEMO Easy And Fast Copy , MT4 DEMO Easy And Fast Copy , MT5 DEMO "Cooperative QQ: 556024" "Kooperation wechat: 556024" "Genossenschaftliche E-Mail: 556024@qq
FREE

Das TPSpro Risk Manager Panel ist ein praktisches Tool für alle, die ihren aktuellen Kontostatus im Blick behalten möchten. Dieses Panel ist Teil unseres Risikomanagementsystems und in unser leistungsstärkeres Produkt TPSpro Risk Manager integriert.
Das Panel besteht aus drei Spalten mit jeweils nützlichen Informationen. Die erste Spalte zeigt die Kontoinformationen zum Monatsbeginn an, einschließlich des Gesamtergebnisses in Prozent und der Einzahlungswährung. Die zweite Spalte zeigt d
FREE

Der RSI-Divergenzindikator ist ein Multi-Timeframe- und Multi-Symbol-Indikator, der uns hilft, Divergenzen zwischen dem Preisdiagramm und dem RSI-Indikator zu finden. Verwenden Sie die Divergenzindikatoren immer zusammen mit anderen technischen Werten wie Unterstützungs- und Widerstandszonen, Kerzenmustern und Preisaktionen, um eine höhere Wahrscheinlichkeit für Trendumkehrungen zu haben. Dieser Indikator identifiziert die Höchst- und Tiefststände sowohl des Preises als auch des RSI-Indikators.
FREE

Entdecken Sie mit dem MT4-Indikator "Super Auto Fibonacci " die Kraft der Präzision und Effizienz für Ihren Handel. Dieses hochmoderne Tool wurde sorgfältig entwickelt, um Ihre technische Analyse zu verbessern und Ihnen unschätzbare Erkenntnisse zu liefern, damit Sie fundierte Handelsentscheidungen treffen können. Hauptmerkmale: Automatisierte Fibonacci-Analyse: Verabschieden Sie sich von der mühsamen manuellen Zeichnung von Fibonacci-Retracements und -Erweiterungen. "Super Auto Fibonacci" ident
FREE

SuperTrend ist einer der besten Trendindikatoren in Metatrader 4 (MT4). Triple SuperTrend-Indikator ist ein Indikator, der aus drei Super-Trend-Indikator, die angeordnet werden können, bestehen. Dieser Indikator ist von mql4 Sprache gebaut und nicht von MT4-Plattform zur Verfügung gestellt. Wir empfehlen Ihnen, den EMA SuperTrend Strategy Indicator zu verwenden, wenn Sie ein besseres Ergebnis erzielen wollen :
https://www.mql5.com/en/market/product/91664
Dieser Indikator ist einfach zu bediene
FREE
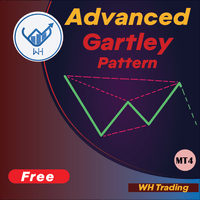
Willkommen beim Advanced Gartley Pattern Recognition Indicator Dieser Indikator erkennt Gartley-Muster basierend auf HH und LL der Preisstruktur und Fibonacci-Niveaus, und wenn bestimmte Fib-Niveaus erreicht werden, zeigt der Indikator das Muster auf dem Diagramm an. MT5-Version: WH Advanced Gartley Pattern MT5
**Dieser Indikator ist Teil von Combo WH Ultimate Harmonic Patterns MT4 , einschließlich der gesamten Mustererkennung.** Merkmale : Erweiterter Algorithmus zur Erkennung des Ga
FREE
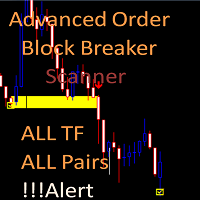
Advanced Order Block Breaker Scanner
Dieser Scanner kann kostenlos heruntergeladen werden, ist aber davon abhängig, dass Sie den Advanced Order Block Breaker Indikator besitzen. Sie müssen den Indikator hier kaufen: https: //www.mql5.com/en/market/product/59127
MT5-Version: https: //www.mql5.com/en/market/product/62769
Der Scanner zeigt Ihnen auf einem einzigen Chart alle Timeframes (M1 bis Monthly) mit ihrem eigenen Status für den Indikator: advance order block breaker Scannen Sie alle Zeitr
FREE

Auf der Welle des Trends reiten – Klare Signale für den Einstieg An den Finanzmärkten entstehen die stabilsten Gewinnchancen oft in klaren Trendphasen. Doch selbst erfahrene Trader tun sich schwer, diese Bewegungen zuverlässig zu nutzen. Ride the Trend Signal ist ein Signalindikator, der speziell für Rücksetzer innerhalb eines bestätigten Trends konzipiert wurde. Anstatt den Einstieg am Anfang eines Trends zu suchen, konzentriert sich dieser Indikator auf die zweite oder dritte Welle – nach Best
FREE
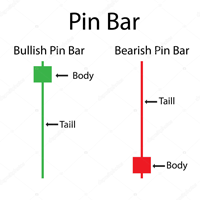
Pin-Bar-Muster sind gekennzeichnet durch einen langen oberen oder unteren Docht mit einem kleinen Körper im Verhältnis zur Größe des Dochts und wenig bis gar keinem unteren oder oberen Schatten. Pin-Bars dürfen nicht isoliert gehandelt werden , sondern müssen im größeren Kontext der Chartanalyse betrachtet werden. Ein Pin-Bar-Einstiegssignal kann in einem Trendmarkt einen sehr wahrscheinlichen Einstieg und ein gutes Risiko-Ertrags-Verhältnis bieten.
Eingaben MinimumTailPips- Mindestgröße des T
FREE
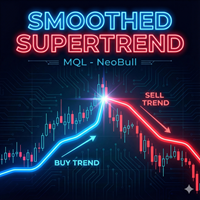
Smoothed Supertrend Indicator - Volatilitätsbasierter Trendindikator mit Glättungsfunktion Der Smoothed Supertrend Indicator ist eine erweiterte Variante des klassischen Supertrend-Indikators für MetaTrader 4 . Durch die Integration einer zusätzlichen Glättungsfunktion werden Marktrauschen reduziert und die Qualität der Trendsignale verbessert. Technische Beschreibung: Der Indikator basiert auf dem Average True Range (ATR) zur Messung der Marktvolatilität und kombiniert diesen mit einer Moving A
FREE

Der Indikator zeigt jeden Text und jedes Bild auf dem Chart an und kann auch Informationen anzeigen, die von Makros angefordert werden. Es gibt drei Textblöcke und einen Block für Bilder. Schriftart, Größe, Farbe, Einrückung und Positionierung sind frei wählbar. UPD1 Watermark ist ein sehr nützliches Werkzeug, wenn Sie Ihre Screenshots mit einem Branding versehen oder die gewünschten Informationen in einem Chart anzeigen möchten.
Beschreibung der Einstellungen.
Texteinstellungen (3 Blöcke). T
FREE

Optimale Strategie
Seien Sie Ihr Handelsassistent MT Merit Candle Count :
Der Indikator wurde für den Handel mit binären Optionen entwickelt und zählt die Anzahl der bullishen oder bearishen Candlesticks. Er eignet sich sowohl für Martingale- als auch für Standard-Handelsstrategien.
Er ist ideal für erfahrene Händler und für den Forex-Handel geeignet, da er hilft, das Volumen abzuschätzen und Trends oder potenzielle Umkehrungen im Chart zu erkennen. Indikator für Trader, die den manuellen Hand
FREE
Optimieren Sie Ihre Handelsanalyse mit dem Day and Week Separator MT4, einem intuitiven Tool, das anpassbare Tages- und Wochentrennlinien zeichnet, ideal für Trader, die mit Zeitunterschieden zwischen Brokern zu kämpfen haben. In Handelsgemeinschaften wie Forex Factory und Reddit’s r/Forex wird dieses Tool für seine Einfachheit und Effektivität geschätzt, da es die häufige Herausforderung löst, Chart-Zeitrahmen mit lokalen oder marktspezifischen Zeiten abzustimmen, wie es in Diskussionen auf Pla
FREE

Der Swing-High-Low-Indikator ist ein unverzichtbares Werkzeug für Händler, die sich auf Preisaktionen verlassen. Er markiert automatisch wichtige Umkehrpunkte (Swing Highs in rot, Swing Lows in grün) und hilft Ihnen, Trends zu visualisieren, Ausbrüche zu erkennen und präzise Trendlinien zu zeichnen. Durch die Hervorhebung dieser kritischen Niveaus zeigt der Indikator Verschiebungen in der Marktstruktur auf - ob sich der Trend verstärkt, umkehrt oder in eine Konsolidierung übergeht. Der Indikator
FREE

Moving Average Trend Alert ist ein dreifacher MA-Indikator, der Händlern hilft, potenzielle Markttrends auf der Grundlage der Ausrichtung und Überkreuzung von 3 MAs zu erkennen.
Merkmale von Moving Average Trend Alert: Anpassbare kurzfristige, mittelfristige und langfristige MAs. Option zum Filtern von Signalen basierend auf einem Mindestabstand zwischen gleitenden Durchschnitten, um eine vorzeitige Ausrichtung der MAs zu vermeiden. Optionale Filterung von Signalen mit dem RSI-Indikator für übe
FREE

Zeitabschnitt OPEN-HIGH-LOW-CLOSE Dieser Indikator zeichnet die Linien der OHLC-Levels der vom Benutzer definierten Time Session. Es werden fließende Linien auf dem Chart des aktuellen Tages gezeichnet. Die Zeiteinheit kann der aktuelle Tag oder der vorherige Tag sein. Sie können mehrere Session-Linien zeichnen, indem Sie jeder Session eine eindeutige ID zuweisen. Es kann sogar historische Niveaus des vom Benutzer ausgewählten Zeitraums im Diagramm anzeigen, um einen Rückdatierungstest durchzuf
FREE
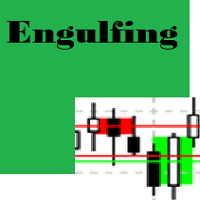
Engulfing Candle Detektor
Erkennbare Muster Double Candlestick-Muster Bullish Engulfing
Die erste Kerze ist eine schwarze Kerze. Die zweite Kerze eröffnet mit einer Lücke unter dem realen Körper der schwarzen Kerze, erholt sich aber nach oben und schließt über dem realen Körper der schwarzen Kerze. Mit anderen Worten, der reale Körper der zweiten Kerze verschlingt den realen Körper der ersten Kerze vollständig. Bearish Engulfing
Die erste Kerze ist eine weiße Kerze. Die zweite Kerze eröffnet m
FREE

Modified oscillator MACD. A classic indicator that combines a trend indicator with an oscillator to detect entry points. Has a multi-timeframe panel and 3 types of notifications
Benefits:
Works on all instruments and timeseries Trend indicator with oscillator for inputs Multi-period panel on all timeframes Pluggable arrows when signals appear Three types of notifications: push, email, alert
MT5 version -> HERE / Our news -> HERE
How the indicator works:
AW Classic MACD - Indicator of
FREE

MQLTA Support Resistance Lines ist ein Indikator, der die historischen Unterstützungs- und Widerstandsniveaus berechnet und sie als Linien im Chart anzeigt. Er warnt Sie auch, wenn sich der Preis in einer sicheren oder gefährlichen Handelszone befindet und zeigt Ihnen den Abstand zum nächsten Level an. Der Indikator ist ideal für die Verwendung in anderen Expert Advisors über die iCustom-Funktion. Dieser Indikator kann LIVE auf AUDNZD mit dem folgenden DEMO https://www.mql5.com/en/market/product
FREE

INFOPad ist eine Informationsanzeige, die Informationen zum ausgewählten Währungspaar im MetaTrader 4-Terminal erstellt. Es gibt 5 Funktionen dieses Indikators: Zeigt die wichtigsten und wichtigsten Informationen zum ausgewählten Symbol an: BID, Spread, Stop-Level, Swap, Tick-Wert, Provisionspreise; Zeigt die zukünftigen Ziele von SL-Ziel und TP-Ziel (Anzahl der Punkte des festgelegten Stop-Loss- und Take-Profit-Gewinns, Dollarbetrag); Es zeigt den erzielten Gewinn für die Zeiträume: Heute, Woc
FREE
Vielen Dank für Ihr Interesse an "Goldfish Indicator". Ich handle seit 2008. Normalerweise handele ich auf dem Renko-Chart im Umkehrmuster mit dem Goldfish-Indikator. Wenn Sie mir Ihre vps-Daten mitteilen, werde ich Ihr Konto einrichten (Live/Demo). Um gute Ergebnisse zu erhalten, kopieren Sie meine Trades für mindestens 30 Tage. Mindesteinlage: $1000 Hebelwirkung: 100:1 Gewinn-Ziel: Monatliches durchschnittliches Gewinnziel ist 10% bis 20%+/- Auszahlung: Der durchschnittliche Drawdown liegt be
FREE

IceFX SpreadMonitor ist ein spezieller Spread-Logging-Indikator, der die aktuellen, minimalen/maximalen und durchschnittlichen Spread-Werte anzeigt. Diese Werte sind so eingestellt, dass sie auch nach einem Neustart sichtbar sind. Außerdem kann SpreadMonitor alle gewünschten Spread-Werte in .csv-Dateien speichern, um die Ergebnisse später zu analysieren.
Indikator-Parameter: SpreadLowLevel - niedriges Niveau des Spreads (zeigt den Wert in grüner Farbe an) SpreadHighLevel - hohes Niveau der Stre
FREE

Ein Indikator, der sowohl für Anfänger als auch für Profis geeignet ist. RECOMMEHDATION Handel mit diesem Indikator für 2-3 Wochen und Sie werden erhebliche Fortschritte in Ihrem Handel fühlen. Dieser Indikator wurde auf der Grundlage von HMA, Laguerre, CCI entwickelt. Der Indikator ist klar und erfordert keine Einstellung. Er wird nicht neu gezeichnet und funktioniert mit dem Eröffnungsbalken. Er funktioniert auf den Zeitrahmen M1-D1. Ich verwende Zeitrahmen M5, um den Markt zu betreten .
FREE

Fluss-Trend Flow Trend wurde entwickelt, um den Markttrend mit einer speziellen Berechnung und einer Kombination aus Bolinger-Band und statistischer gleitender Periode
zu erkennen, um den Markttrend ohne Frequenzwechsel und Fehler zu erkennen.
Dieser Indikator ist mit einfachen Parametern entworfen, um schnell und einfach und hilfreiche Werkzeuge zu verwenden, um in einer reinen Richtung zu handeln und setzen Sie Ihre SL/TP mit diesem Indikator Cloud-System.
FREE

Dieser Indikator ermöglicht es Ihnen, Ihr Engagement zu verwalten und zu sehen, wie sich das Lot verändert. Sie können den optimalen Lot-Wert für Ihr Depot wählen, ohne echte Positionen zu eröffnen. Und Sie können auch neue Handelsinstrumente bewerten. Wenn Sie manuell handeln, wird Ihnen das Risikomanagement helfen, unerwartete Verluste zu vermeiden. Der Indikator bietet die Möglichkeit, bei Erreichen eines bestimmten Niveaus ein akustisches Signal zu erhalten sowie Push-Benachrichtigungen und
FREE

Der Indikator zeigt die wahrscheinlichen Niveaus (Unterstützung und Widerstand ) an. Der Indikator zeichnet horizontale und trendmäßige Unterstützungs- und Widerstandsniveaus. Die Einstellungen des Indikators: Trends - der Modus für die Anzeige von Trendlinien oder horizontalen Linien der Unterstützung und des Widerstands Ja - nur Trendlinien anzeigen Nein - nur horizontale Linien anzeigen UseResource - Verwendung der in den Indikator integrierten Ressourcen. Ja - verwendet den ZigZag-Indikator
FREE

Necessary for traders: tools and indicators Waves automatically calculate indicators, channel trend trading Perfect trend-wave automatic calculation channel calculation , MT4 Perfect trend-wave automatic calculation channel calculation , MT5 Local Trading copying Easy And Fast Copy , MT4 Easy And Fast Copy , MT5 Local Trading copying For DEMO Easy And Fast Copy , MT4 DEMO Easy And Fast Copy , MT5 DEMO Fortgeschrittene Bollinger Bands:
1. Die Bollinger-Schiene ändert ihre Farbe mit der Richtung
FREE
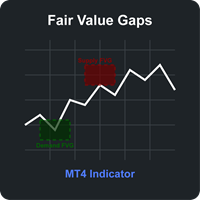
Fair Value Gaps (FVG) Indikator für MT4 Der Fair Value Gaps (FVG) Indikator ist ein leistungsstarkes Werkzeug der technischen Analyse zur Identifizierung und Visualisierung signifikanter Preisungleichgewichte im Markt. Diese Lücken entstehen, wenn der Preis eine starke Richtungsbewegung macht und stellen Bereiche dar, in denen der Preis so schnell gestiegen oder gefallen ist, dass keine Handelsaktivität stattfand – ein mögliches Zeichen für institutionelles Interesse und starken Marktimpuls. Hau
FREE

Wir stellen Ihnen einen Indikator vor, der nicht nur den visuellen Aspekt des Charts aufwertet, sondern ihm auch einen lebendigen, dynamischen Charakter verleiht. Unser Indikator ist eine Kombination aus einem oder mehreren gleitenden Durchschnittsindikatoren (MA), die ständig ihre Farbe ändern und so ein interessantes und farbenfrohes Aussehen erzeugen.
Da es sich bei diesem Produkt um eine grafische Lösung handelt, ist es schwierig, seine Funktionsweise in einem Text zu beschreiben; es ist e
FREE
Erfahren Sie, wie man einen Handelsroboter im MetaTrader AppStore, dem Shop für Applikationen für die MetaTrader Handelsplattform, kaufen kann.
Das Zahlungssystem der MQL5.community ermöglicht Zahlungen mit PayPal, Kreditkarten und den gängigen Zahlungssystemen. Wir empfehlen Ihnen eindringlich, Handelsroboter vor dem Kauf zu testen, um eine bessere Vorstellung von dem Produkt zu bekommen.
Sie verpassen Handelsmöglichkeiten:
- Freie Handelsapplikationen
- Über 8.000 Signale zum Kopieren
- Wirtschaftsnachrichten für die Lage an den Finanzmärkte
Registrierung
Einloggen
Wenn Sie kein Benutzerkonto haben, registrieren Sie sich
Erlauben Sie die Verwendung von Cookies, um sich auf der Website MQL5.com anzumelden.
Bitte aktivieren Sie die notwendige Einstellung in Ihrem Browser, da Sie sich sonst nicht einloggen können.