Investment Castle Support and Resistance MT4
- 指标
- 版本: 1.4
- 更新: 7 八月 2021

Investment Castle 支撑与阻力 — 自动买卖位
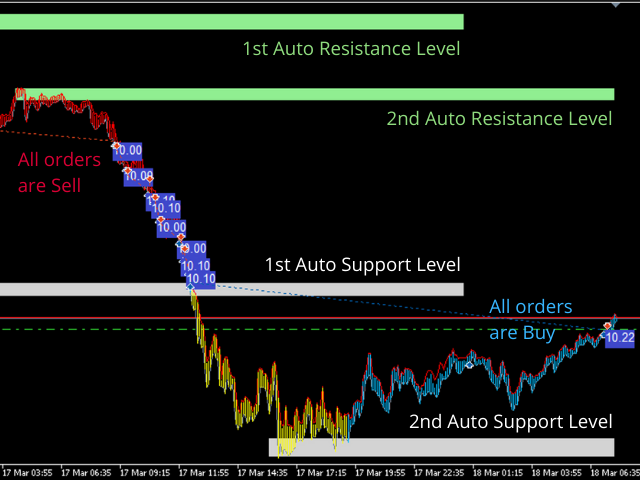
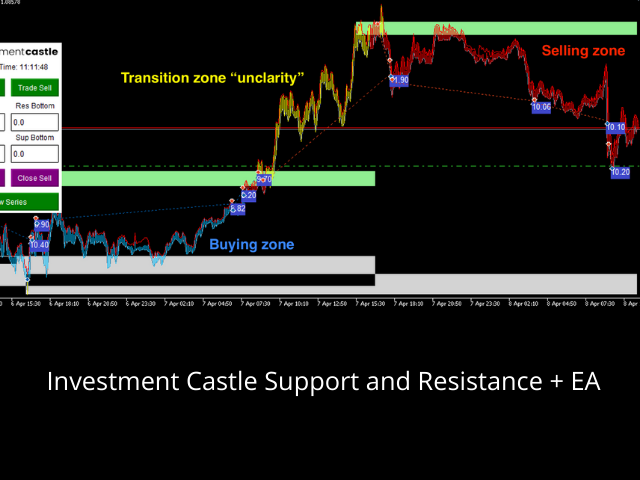
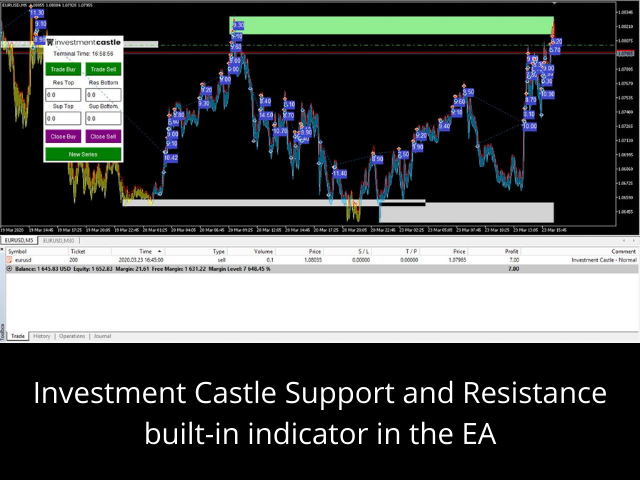
不再手动绘制支撑与阻力。该指标自动为您标出关键的买入和卖出价位,并按方向为K线着色,让市场倾向的一侧一目了然。它与 Investment Castle EA 内置的支撑与阻力引擎完全相同。
它能为您做什么
- 自动买卖位:支撑与阻力自动检测并绘制——无需手动画线。
- 方向颜色提示:K线默认买入变蓝、卖出变红(可在参数中调整)。
- 更快决策:立刻看清价格可能反应的位置以及偏向哪个方向。
- 体系的一部分:Investment Castle EA 的支撑与阻力核心,与心理关键价位配合使用。
- 处处适用:任何品种、任何周期。
适合人群:希望获得干净、客观的支撑/阻力位而免去手动绘图的交易者。
风险提示:交易存在重大亏损风险。请务必先在模拟账户上测试,并使用您能接受的风险设置。过往表现不代表未来结果。


Perfect work again !!! Big thanks