Investment Castle Trend Lines MT4

Investment Castle 趋势线 — 价格行为,自动为您绘制
出色的交易始于读懂趋势——供需、上升与下降通道、趋势线和吞没K线。Investment Castle 趋势线会在您的图表上自动整合这幅价格行为图景,让您以更少的猜测和更小的压力抓住趋势。
它能为您做什么
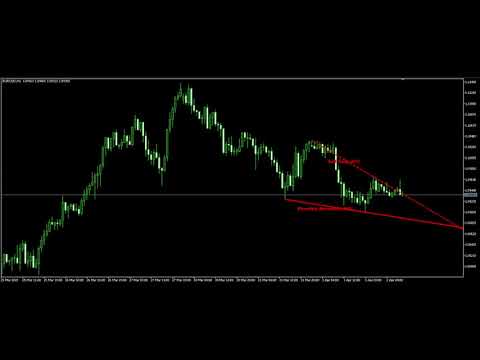
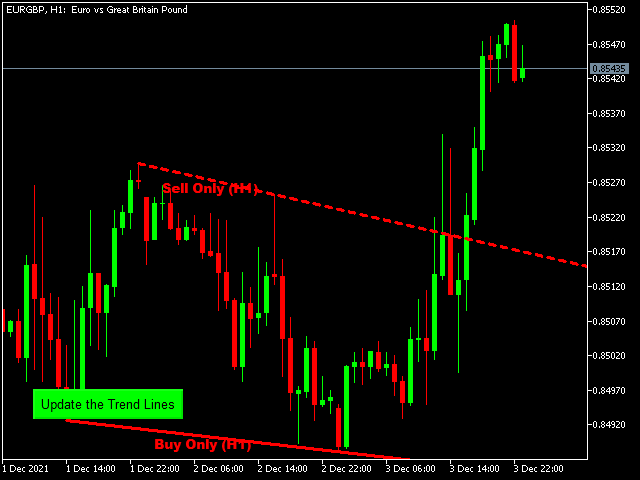
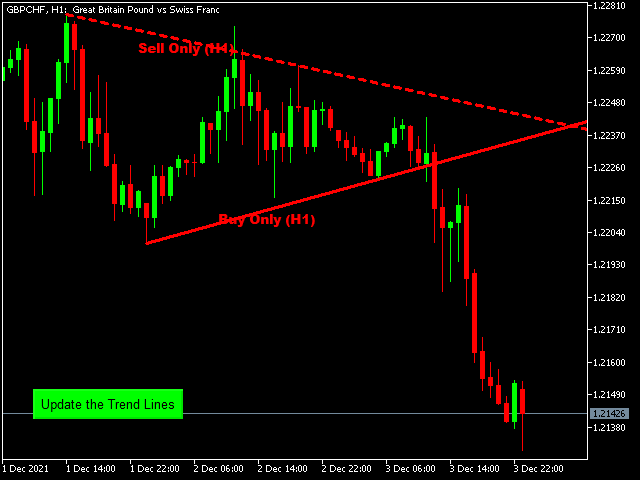
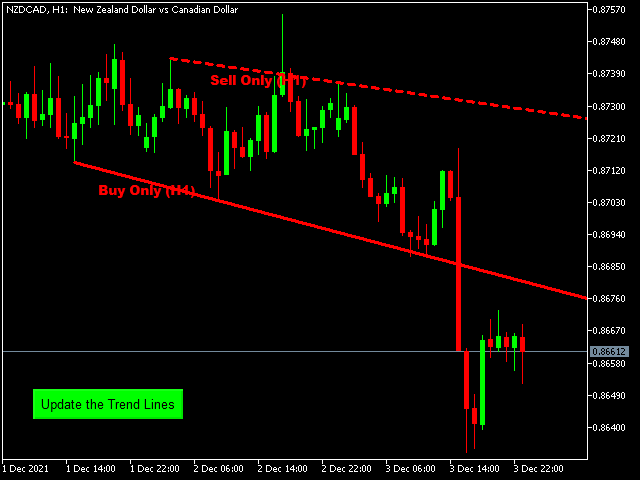
- 自动趋势线:主导的趋势线为您绘制——无需手动作图。
- 价格行为背景:结构、方向和关键转折点一目了然。
- 更少压力、更快判断:把时间用在决策上,而非画线。
- 基于经过验证的价格行为:专业交易者抓趋势所用的同一方法。
- 处处适用:任何品种、任何周期。
适合人群:希望入场前就看到趋势的价格行为交易者。
风险提示:交易存在重大亏损风险。请务必先在模拟账户上测试,并使用您能接受的风险设置。过往表现不代表未来结果。


5 stars!!! Thank you!