Channels Indicator
- 指标
- 版本: 1.3
- 更新: 6 十二月 2021

Investment Castle Channels — Trade With the Flow
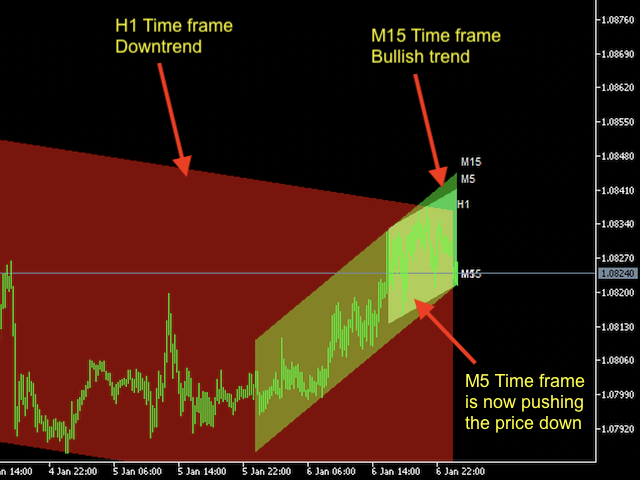
Price always flows within rising and falling channels. This non-repainting indicator projects those channels for you on any timeframe, giving you a clear path for placing buy and sell trades — the levels experienced traders draw by hand, mapped for you automatically.
What it does for you
- Non-repainting channels: rising and falling channels projected from real price structure.
- Multi-timeframe: see the channels that matter on any timeframe, or across several at once.
- A clear trading path: know where price is likely to bounce, break or continue.
- Saves manual work: the channels professionals draw by hand, drawn for you.
- Works everywhere: any symbol, any timeframe.
Who it is for: channel and trend traders who want clean, objective channel mapping.
Risk warning: trading involves substantial risk of loss. Always test on a demo account first and use risk settings you are comfortable with. Past performance does not guarantee future results.


Pretty good indicator. Clean and accurate.