Time and Price Fractal Studies
- 指标
- 版本: 1.1
- 更新: 20 九月 2021

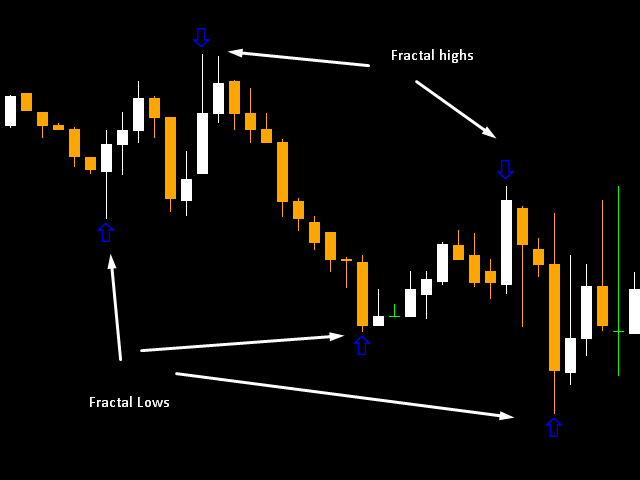
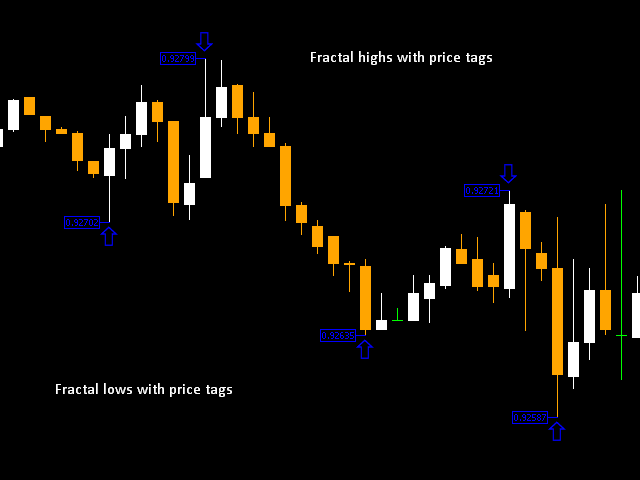
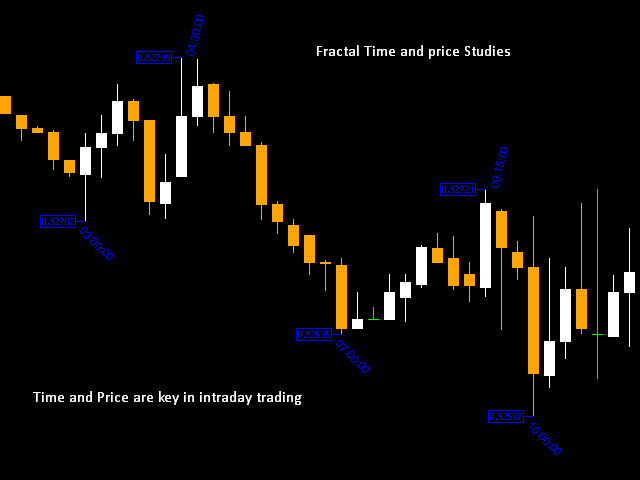
Time and Price Fractal Studies is an indicator that will help you identify certain patterns that tend to repeat themseleves at certail times of the day or at certain prices.
It is used to study Fractal Highs ad Lows in relation to time and price.
You will get to answer certail questions like:
- At what time of day does this market usually turn around.
- At what price does the market turn. Is it at round numbers etc.


Obrigado por compartilhar