Wolfalizer
- 指标
-
John Davis
 Introducing John, an independent-minded coder and algorithmic trader who has forged a solo career crafting financial strategies using MetaQuotes languages, MQL4 and MQL5. Driven by a blend of analytical thinking and a love for technology, John has become a self-made expert, navigating the dynamic
 - 版本: 1.0
- 激活: 20
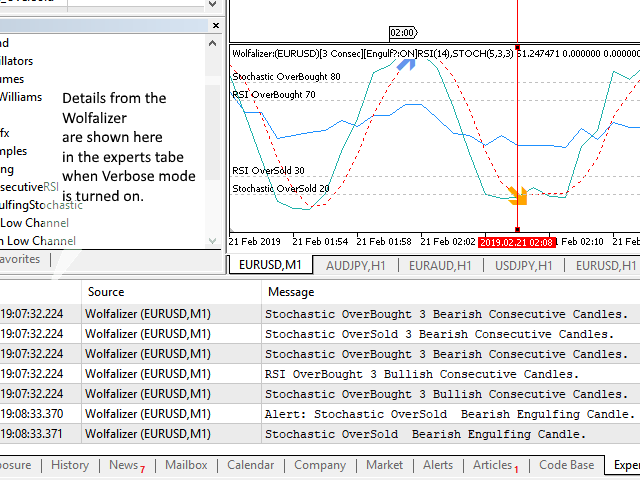
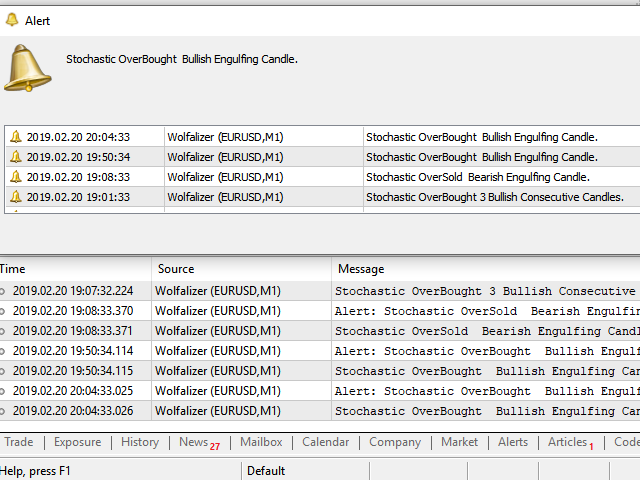
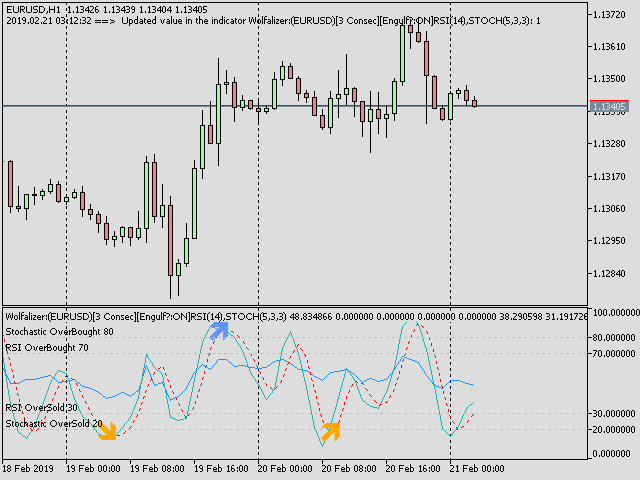
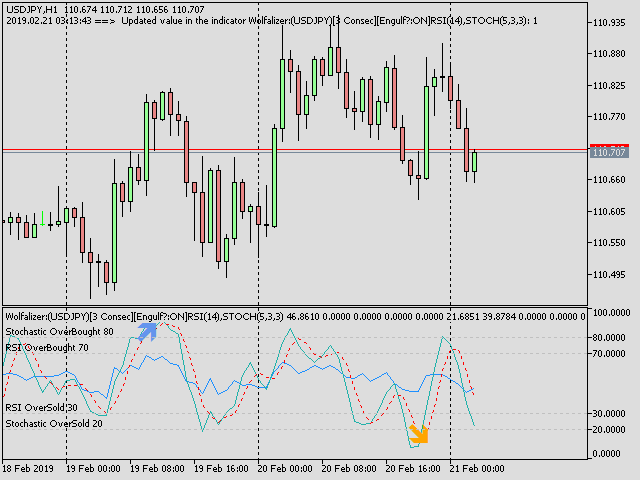
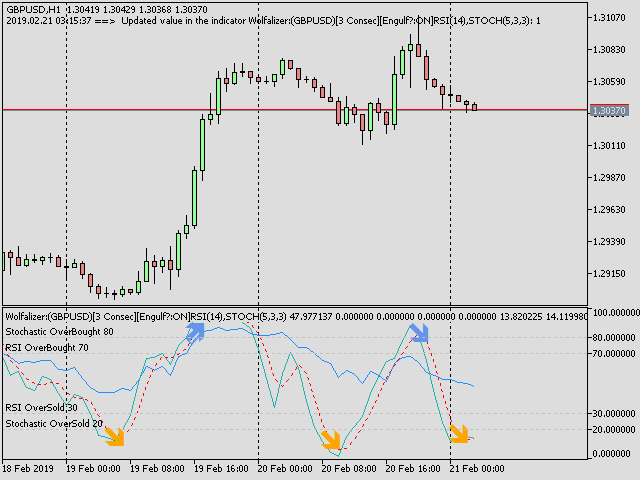
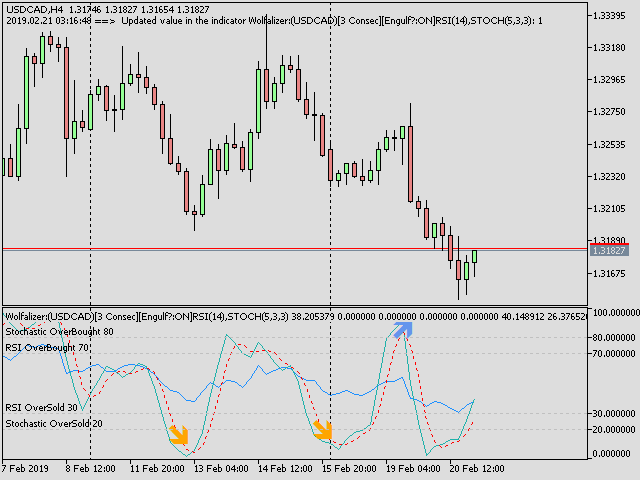
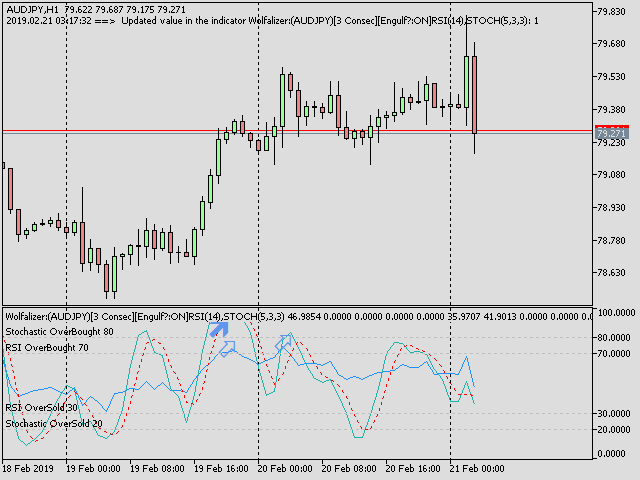
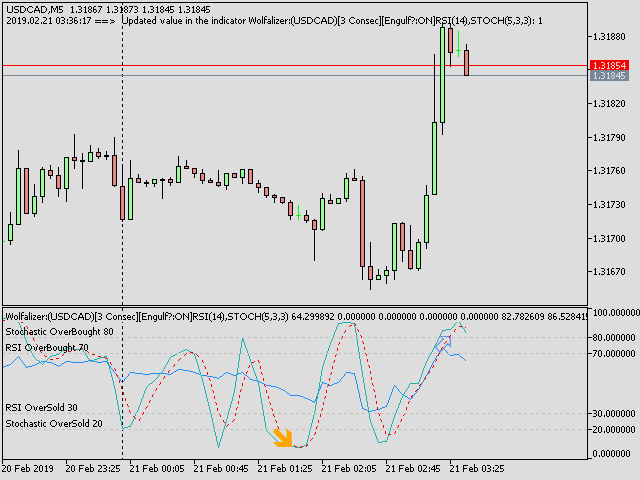
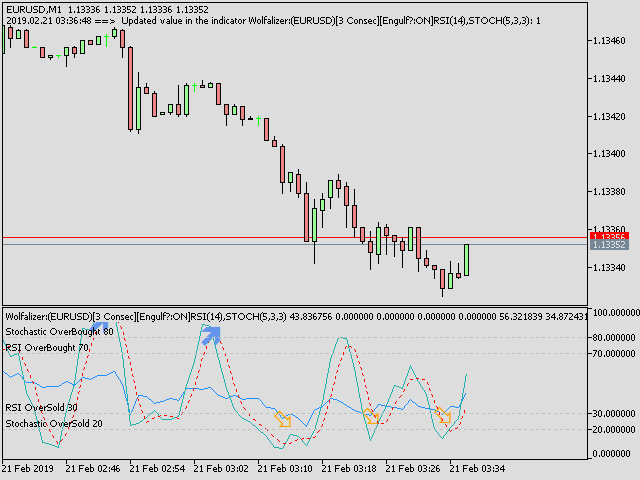
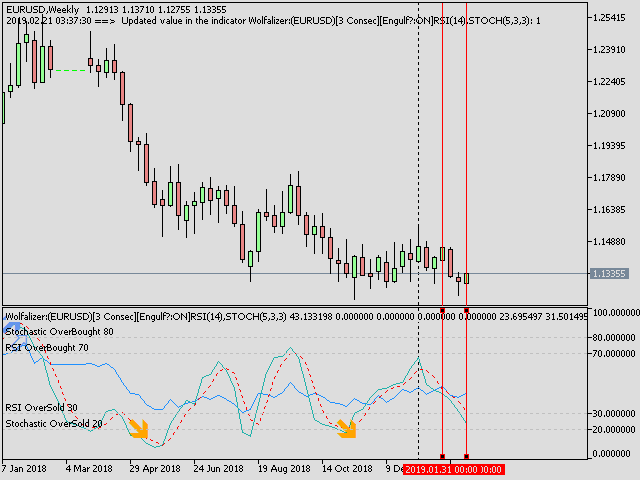
The Wolfalizer Indicator combines the functionality of the Engulfing Stochastic along with the ConsecutiveRSI and adds alerts along with more detailed output to the journal. This Indicator will alert you when RSI or Stochastics cross into oversold or overbought. You can set the oversold and overbought levels for RSI and Stochastics separately. You can pick if you want an engulfing candle to appear on the cross or set a number of consecutive candles you would like to see.
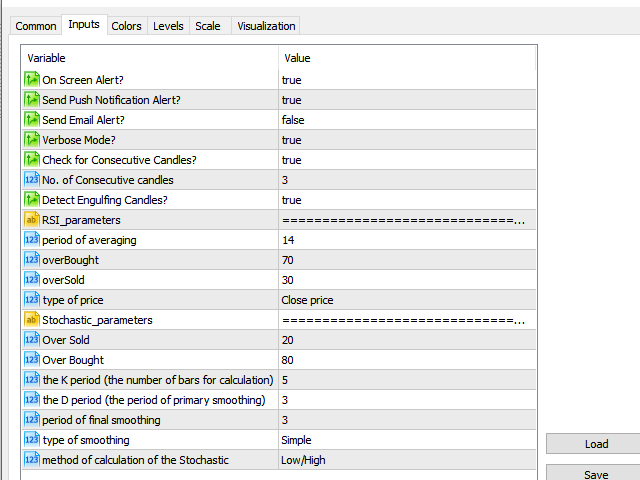
Interesting Inputs include:
- Turning on or off on-screen alerts
- Push to phone alerts
- Emailed alerts
- Verbose mode gives additional details in the journal tab
- Turn to check for consecutive candles on or off
- The number of consecutive candles you would like to see at a cross
- Turn to check for engulfing candles at crosses on or off
- RSI settings
- Stochastic settings
MT4 version https://www.mql5.com/en/market/product/36133
This section is for the coders:
   SetIndexBuffer(0,iRSIBuffer,INDICATOR_DATA);
   SetIndexBuffer(1,bulloversold,INDICATOR_DATA);
   SetIndexBuffer(2,bearoversold,INDICATOR_DATA);
   SetIndexBuffer(3,bulloverbought,INDICATOR_DATA);
   SetIndexBuffer(4,bearoverbought,INDICATOR_DATA);
   SetIndexBuffer(5,StochasticBuffer,INDICATOR_DATA);
   SetIndexBuffer(6,SignalBuffer,INDICATOR_DATA);
   SetIndexBuffer(7,StochBullishOverSold,INDICATOR_DATA);
   SetIndexBuffer(8,StochBearishOverSold,INDICATOR_DATA);
   SetIndexBuffer(9,StochBullishOverBought,INDICATOR_DATA);
   SetIndexBuffer(10,StochBearishOverBought,INDICATOR_DATA);
   SetIndexBuffer(11,barNum,INDICATOR_DATA);
None NULL value when a signal is given.

用户没有留下任何评级信息